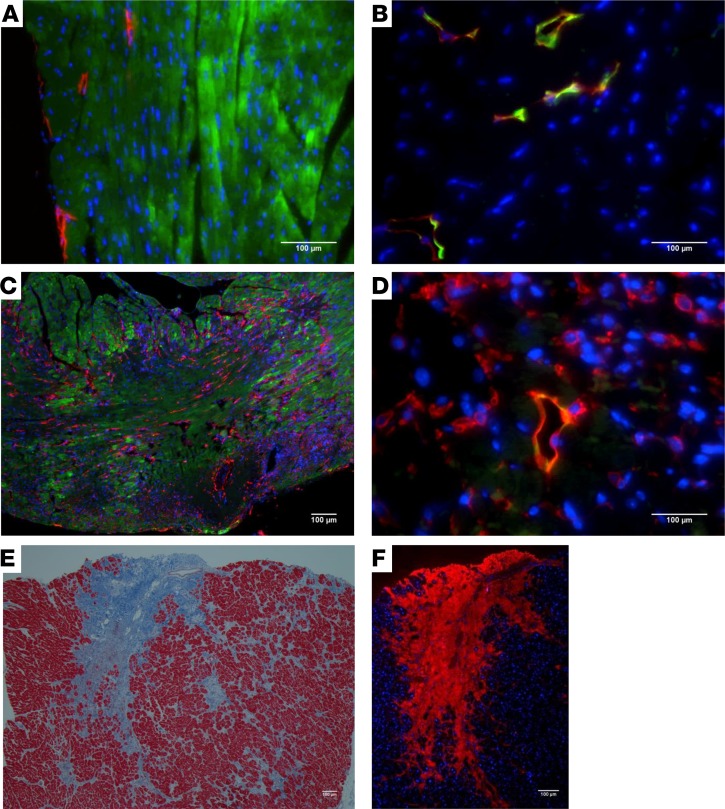
Figure 1. PDPN expression in mouse model of MI and human ischemic hearts.
Thin cardiac sections from control sham-operated (A and B) and infarcted (C and D) mouse hearts at 2 days after surgery were indirectly immunolabeled with (A and C) PDPN in red, α-SARC actin in green, nuclei in blue, (B and D) PDPN in red, LYVE-1 in green, and nuclei in blue, respectively. (C and D) The area represents the infarct/BZ of the MI and shows the increase in PDPN expression at 2 days after MI (n = 3/group). (E and F) Thin cardiac sections obtained from ischemic human hearts were stained with Masson’s trichrome (E) and (F) indirectly immunolabeled with PDPN Ab in red, nuclei in blue. Note that the infarcted/fibrotic tissue in blue (E) corresponds to the area in red (F) and is highly positive for PDPN (n = 5/group).

