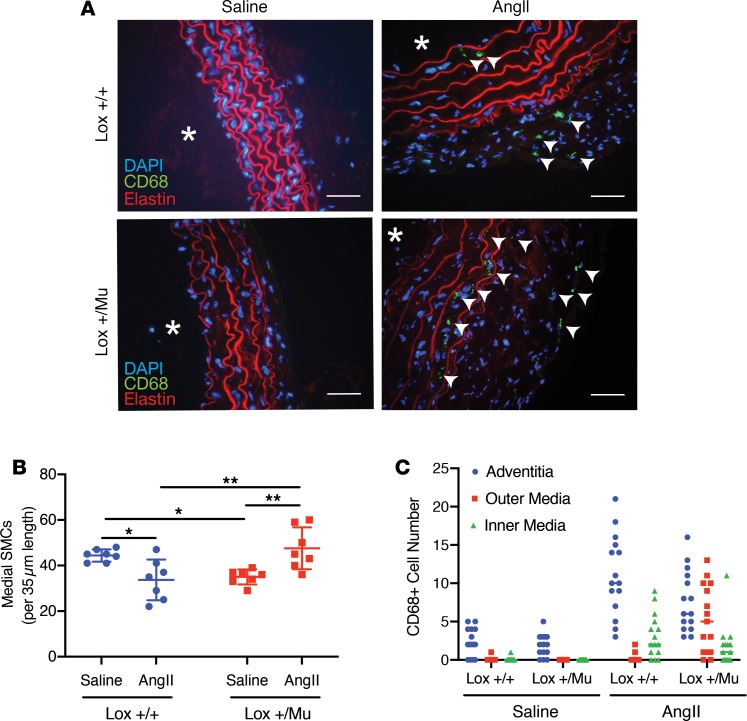
Figure 2. Ang II treatment leads to changes in vascular cellularity and infiltration of immune cells.
(A) Frozen sections of descending aorta from Lox+/+ and Lox+/Mu animals following 28 days of treatment with Ang II or saline (asterisks indicate vessel lumen; scale bars: 5 μm). Macrophages (stained green, arrowheads) were detected with an antibody to CD68, and cell nuclei were visualized with DAPI. Red is elastin autofluorescence. The vessel wall was thicker in both Lox+/+ and Lox+/Mu animals following Ang II treatment, with more DAPI+ and CD68+ cells in the adventitia of both genotypes. (B) In the medial layer, there were fewer SMCs in the aorta of WT animals treated with Ang II but more cells in Lox+/Mu aorta. Shown are the mean ± SD for cell number counts between the internal and external elastic lamina on 7 tissue sections from each group. Two-way ANOVA with Tukey’s multiple-comparisons test, with the 2 variables being genotype and treatment, was used to assess differences. Data are presented as mean ± SD. *P < 0.05, **P < 0.01. (C) Medial CD68+ cells were mostly located on the luminal side of the media in the Lox+/+ aorta but nearer the adventitia in Lox+/Mu aorta after Ang II treatment.

