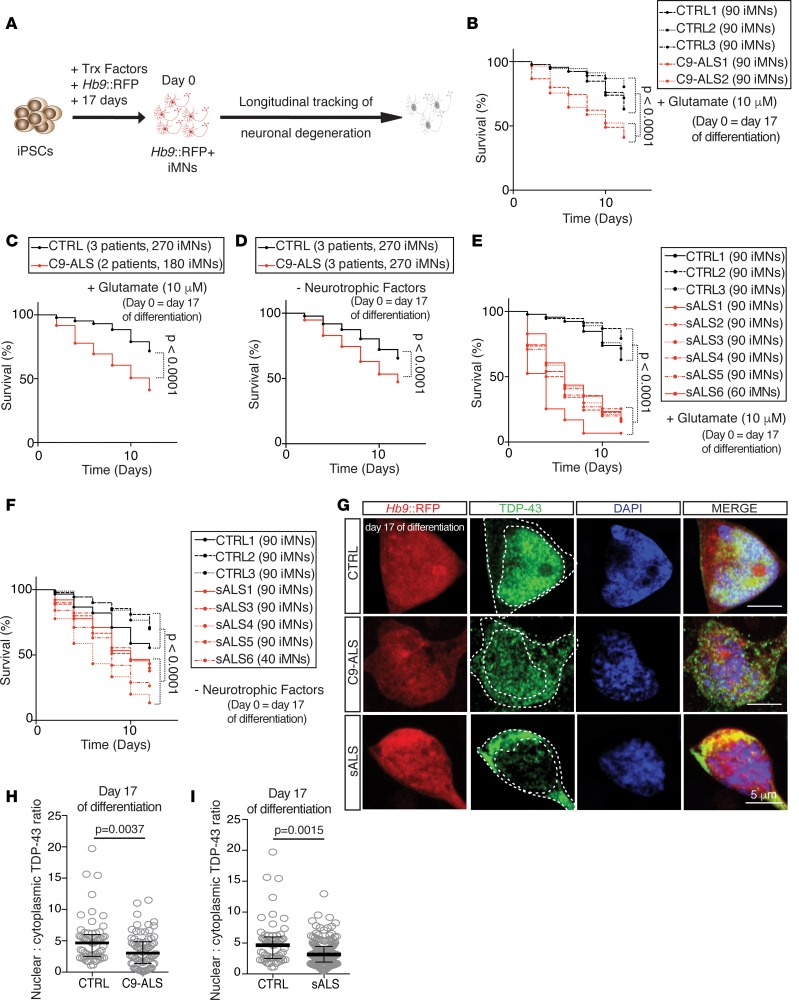
Figure 1. Identification of neurodegenerative phenotypes in sporadic ALS patient iMNs.
(A) Production of Hb9::RFP+ iMNs and survival tracking by time-lapse microscopy. (B and C) Survival of control (CTRL) and C9ORF72 ALS patient (C9-ALS) iMNs with a 12-hour pulse treatment of excess glutamate shown for each individual line separately (B), or for iMNs from all lines in aggregate (C). For B and C, n = 90 iMNs per line for 3 control and 2 C9-ALS lines, iMNs quantified from 3 biologically independent iMN conversions per line. (D) Survival of control and C9ORF72 ALS patient iMNs after withdrawal of neurotrophic factor supplementation. iMNs from all control or C9ORF72 patient lines shown in aggregate. n = 90 iMNs per line for 3 control and 3 C9-ALS lines, iMNs quantified from 3 biologically independent iMN conversions per line. (E and F) Survival of control and sporadic ALS (sALS) patient lines after glutamate treatment (E) or withdrawal of neurotrophic factor supplementation (F). iMNs from all control or C9ORF72 patient lines shown in aggregate. n = 90 iMNs per line for 3 control and 6 (E) or 5 (F) sporadic ALS lines, except sALS6 which had 60 (E) or 40 (F) iMNs counted. iMNs quantified from 3 biologically independent iMN conversions per line. (G–I) Immunofluorescence analysis of total TDP-43 (G) and quantification of the ratio of nuclear to cytoplasmic TDP-43 in control, C9-ALS (H), or sporadic ALS (I) iMNs. Ratio of nuclear to cytoplasmic TDP-43 in individual iMNs treated with 10 nM inactive 3K3A-APC or 3K3A-APC for 6 days. iMNs from 2 controls and 2 C9-ALS patients (H) or 4 sporadic ALS patients (I) were quantified. n = 30 (controls), 30 (C9-ALS), or 36 (sporadic) iMNs per line per condition from 2 biologically independent iMN conversions of 2 control, 2 C9-ALS, or 4 sporadic ALS lines were quantified. Each gray circle represents a single iMN. Median ± interquartile range. Unpaired Mann-Whitney test. Scale bars: 5 μm. Dotted lines outline the nucleus and cell body. For iMN survival experiments, significance was measure by 2-sided log-rank test using the entire survival time course. The day of differentiation stated on each panel indicates the day of differentiation on which the experimental treatment or time course was initiated.

