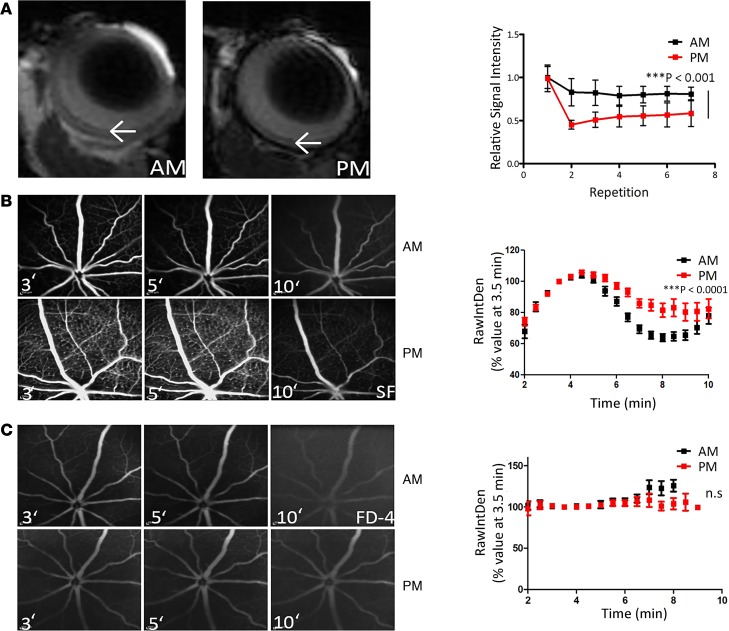
Figure 2. iBRB integrity in the morning compared to the evening in mice.
(A) Gadolinium (800-Da MW) extravasation in the retina of mice at 8 pm (right) compared with 8 am (left). Dynamic contrast-enhanced MRI (DCE-MRI) is quantified in histogram at right. ***P < 0.001 (n = 5 mice for 8 am, and n = 4 mice for 8 pm). (B) Fundus fluorescein angiography (FFA) 3, 5, and 10 minutes after sodium fluorescein (MW: 376 Da) injection at 8 am (top) compared with 8 pm (bottom), with enhanced signal at 8 pm (***P < 0.001, and n = 12 mice for both time points). (C) FFA analysis of FITC-Dextran-4 (FD4) (MW: 4000 Da) at 8 am (top) compared with 8 pm (bottom) (n = 8 mice for both time points). ANOVA was used with Bonferroni’s post hoc test and significance represented by a P value of less than or equal to 0.05.

