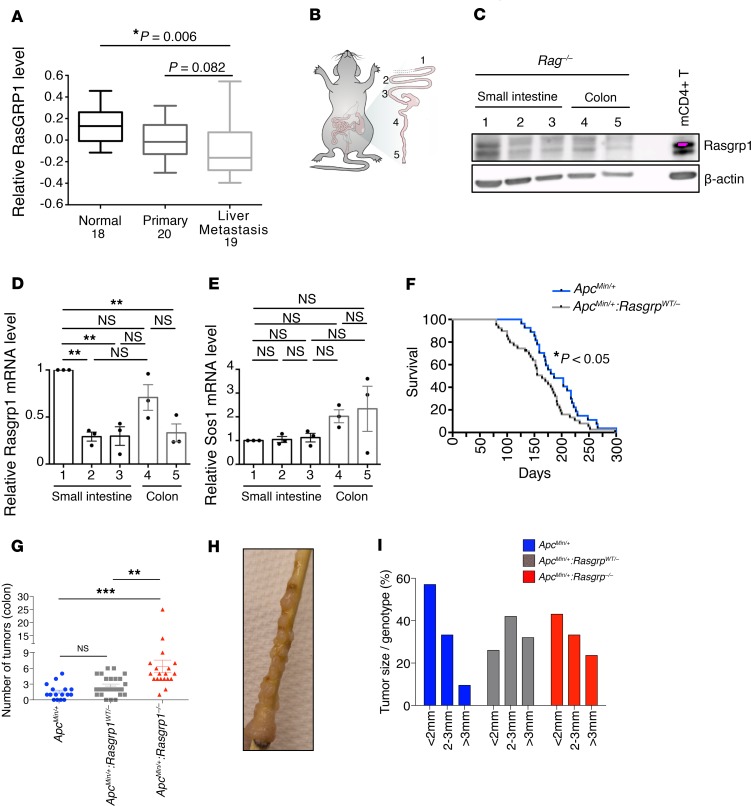
Figure 1. RasGRP1 acts as a tumor suppressor in ApcMin mice.
(A) Normalized RasGRP1 mRNA levels analyzed with GeneSpring GX software. Normal colon (n = 18), primary colonic tumor (n = 20) and liver metastasis (n = 19). One-way ANOVA statistical analysis with Bonferroni corrections was carried out using SPSS 17.0. Post hoc t tests using SPSS Bonferroni-adjusted P values. Box and whisker plots indicate the median value and upper- and lower- quartiles in the box and the upper- and lower- extremes in the whiskers. (B and C) Detection of Rasgrp1 expression by Western blot analysis in different sections of small intestine (duodenum, 1; jejunum, 2; and ileum, 3) and colon (proximal, 4; and distal, 5). The Western blot is a representative example of 3 independent experiments. β-Actin served as protein loading control. Protein lysate from CD4-positive mouse cells (C57BL/6; mCD4+ T) was used as positive control for Rasgrp1. Western blots from 2 more extraction are shown in Supplemental Figure 1. Rasgrp1 (D) and Sos1 (E) mRNA levels determined by TaqMan PCR on distinct portions of the intestinal tract. mRNA expression for one duodenum portion was used as an arbitrary reference and set at 1.0, and other samples values were related to it. Data are presented as fold difference compared with the value of 1.0 in duodenum and plotted from n = 3 independent experiments (n = 3 mice). Each point represents an average of 2 wells. **P < 0.001 (1-way ANOVA, Bonferroni’s multiple-comparisons test). (F) Kaplan-Meier curves of ApcMin/+ mouse survival with different copies of Rasgrp1 alleles. Statistical analysis was performed on ApcMin/+:Rasgrp1WT/– (n = 37) and compared with ApcMin/+ mice (n = 25). *P < 0.05, log-rank (Mantel-Cox) test, which means that the 2 groups are significantly different from each other. (G) Quantification of colonic tumor incidence in ApcMin/+, ApcMin/+:Rasgrp1WT/–, and ApcMin/+:Rasgrp1–/– mice (n = 16, 25, and 19, respectively; **P < 0.05, *** P < 0.001 (1-way ANOVA, Bonferroni’s multiple-comparisons test). One dot represents one mouse. (H) Distal colon of an ApcMin/+:Rasgrp1–/– mouse bearing colonic adenomas. (I) Percentages of colonic tumors of the indicated sizes in ApcMin/+, ApcMin/+:Rasgrp1WT/– and ApcMin/+:Rasgrp1–/– mice (n = 10, 15, and 19, respectively). Additional data are shown in Supplemental Figure 2C.

