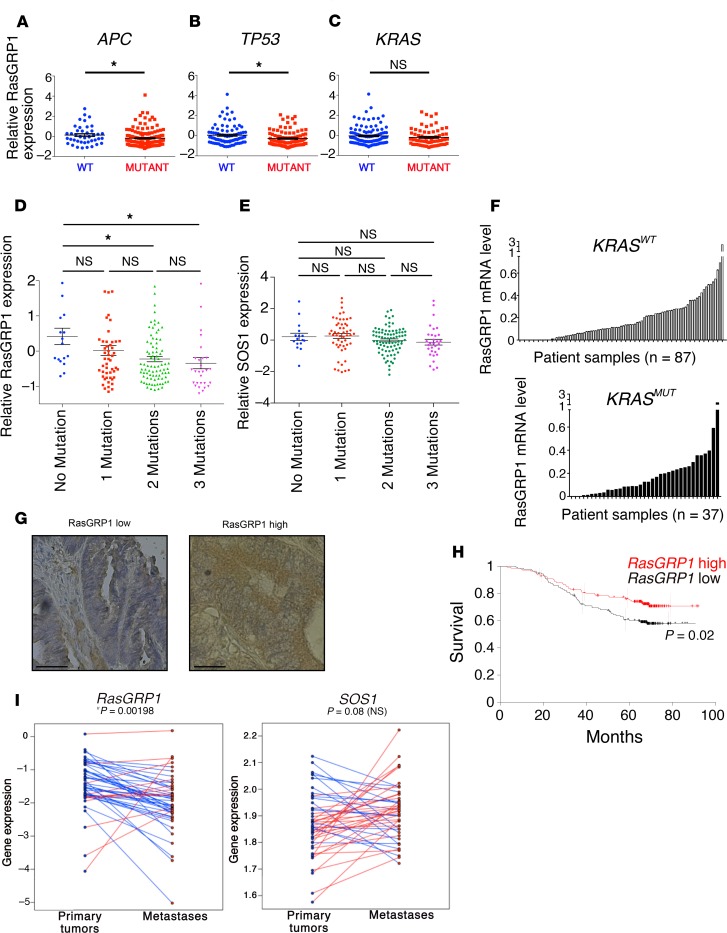
Figure 3. RasGRP1 is a prognostic marker for CRC.
(A–C) RasGRP1 expression in human CRC patients from the TCGA Colorectal Adenocarcinoma data sets. Expression of RasGRP1 in patients with WT versus mutant APC (A), WT versus mutant TP53 (B), and WT versus mutant KRAS (C). Statistical analyses were performed using unpaired t test; *P < 0.05. (D) Analysis of relative RasGRP1 expression using TCGA data as in A–C, organized by number of mutations in APC, TP53, and KRAS. *P < 0.05 (Dunnett’s test). (E) Analysis of relative SOS1 expression using TCGA data as in B–D, organized by number of mutations in APC, TP53, and KRAS. (F) RasGRP1 mRNA expression determined by TaqMan PCR on liver metastasis samples surgically removed from 124 patients with metastatic CRC. KRASmut, n = 87; KRASWT, n = 37. (G) Imunohistochemistry for RasGRP1 (brown staining) on liver metastasis patient samples selected from G with either low or high RasGRP1 levels. Scale bars: 20 μm. (H) Kaplan-Meier overall survival curve for stage II and III PETACC-3 CRC patients (n = 282) carrying KRAS mutation, divided in 2 equal groups of 141 patients expressing high or low levels of RasGRP1 (*P = 0.02, log-rank [Mantel-Cox] test). (I) Analysis of RasGRP1 and SOS1 expression in matched primary and metastatic tumors from patients with metastatic CRC in the MOSAIC program. Gene expression levels (in log2 of RPKM) for RasGRP1 and SOS1 in metastases (red dots) were compared with levels in primary tumors (blue dots). Red lines and blue lines represent increase and decrease in expression level, respectively. Student’s t test was performed to assess the statistical significance between comparisons. *P < 0.05.

