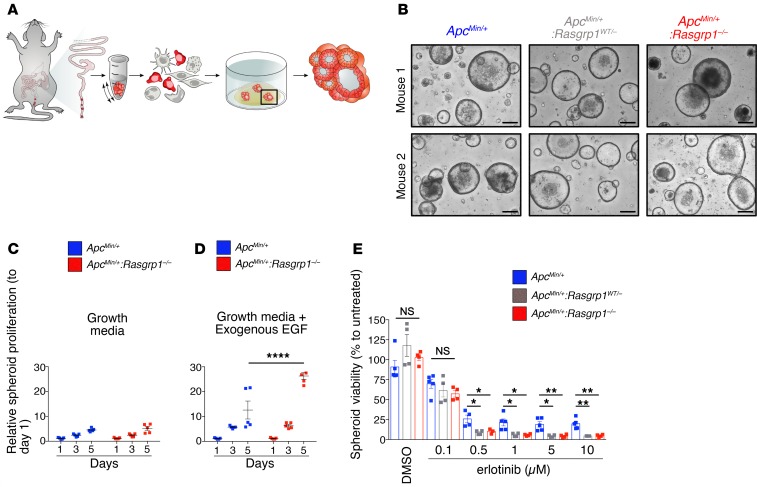
Figure 4. Deletion of Rasgrp1 alleles makes CRC spheroids susceptible to EGFR inhibition.
(A) Scheme of murine CRC organoid generation from colonic tumors. (B) Representative images of CRC organoids from ApcMin/+, ApcMin/+:Rasgrp1WT/–, and ApcMin/+:Rasgrp1–/– colonic adenomas. Each image is a representative example of 40 or more wells of tumor spheroids; 8 wells per mouse tumor and 5 or more mice per genotype. Scale bars: 200 μm. (C and D) Murine ApcMin/+ CRC organoids and ApcMin/+:Rasgrp1–/– CRC organoids were incubated in plain growth media (C) or with exogenous EGF (50 ng/mL) (D). Proliferation rate was evaluated on days 1, 3, and 5 after plating. Data are mean ± SEM and were normalized to day 1. A total of 6 wells for each condition from 2 independent experiments were evaluated (n = 3 ApcMin/+, n = 3 ApcMin/+:Rasgrp1–/– mice). ****P < 0.0001 (2-way ANOVA, Bonferroni’s multiple-comparisons test). (E) ApcMin/+ CRC organoids, ApcMin/+:Rasgrp1–/– CRC organoids, and ApcMin/+:Rasgrp1WT/– CRC organoids were treated with different doses of erlotinib for 3 days. DMSO was used as control. All data were normalized to untreated conditions. A total of 4–5 independent experiments with 4 wells per condition (16–20 wells total) were evaluated. Each dot represents the average of 4 wells, columns indicate the mean, and bars represent the SD (n = 5 ApcMin/+, n = 4 ApcMin/+:Rasgrp1–/– mice). *P < 0.05, **P < 0.01 (Dunnett’s test).

