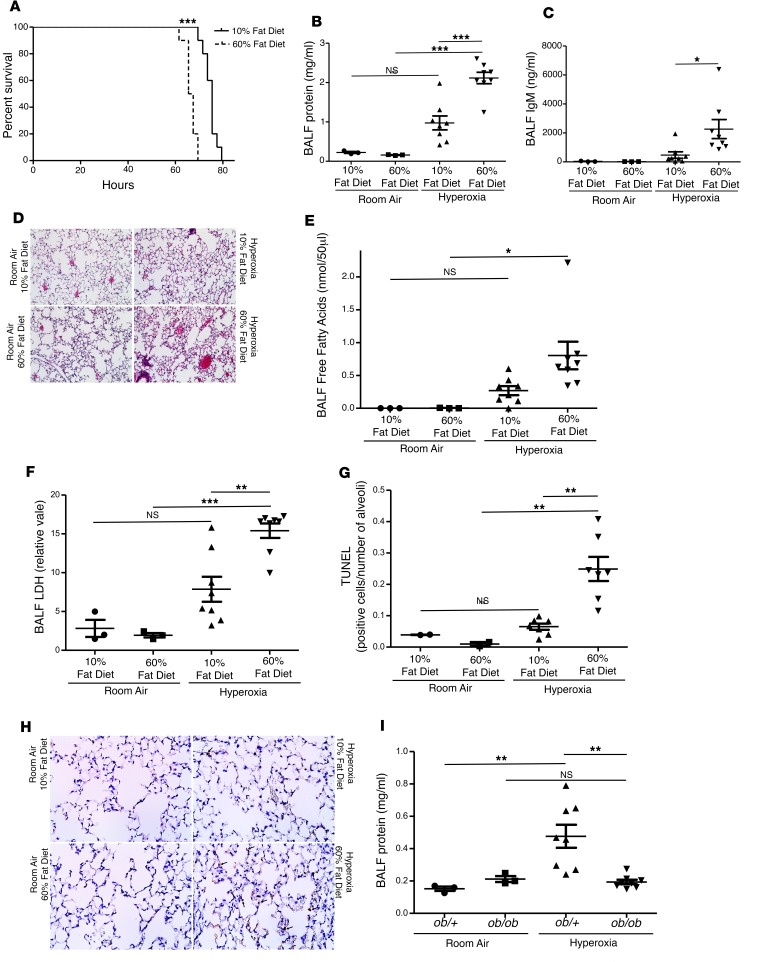
Figure 2. High-fat diet is associated with reduced survival and increased lung injury after exposure to hyperoxia.
(A) Representative survival curve of C57BL/6J mice fed 60% versus ingredient-matched 10% fat diet exposed to >95% oxygen (n = 10 per group, log-rank test, ***P < 0.0001). (B) Bronchoalveolar lavage fluid (BALF) protein levels from mice fed 60% and 10% fat diet after 48 hours of exposure to >95% oxygen or room air (mg/mL n = 3 per group for room air and n = 8 per group for hyperoxia, ANOVA with Tukey’s post hoc correction, ***P < 0.001, similar results were obtained from at least 2 independent experiments). (C) BALF IgM levels from mice fed 60% and 10% fat diet after 48 hours of exposure to >95% oxygen or room air (ng/mL, n = 3 per group for room air and n = 8 per group for hyperoxia, ANOVA with Tukey’s post hoc correction, *P < 0.05, similar results were obtained from at least 2 independent experiments). (D) Representative image of H&E-stained lungs (n = 2 per group for room air and n = 7 per group for hyperoxia; original magnification, ×20). (E) BALF free fatty acid levels after 48 hours of hyperoxia or room air (nmol/50 μL, n = 3 per group for room air and n = 8 per group for hyperoxia, ANOVA with Tukey’s post hoc correction, *P < 0.05). (F) BALF lactate dehydrogenase (LDH) levels after 48 hours of hyperoxia or room air (relative value, n = 3 per group for room air and n = 8 per group for hyperoxia, ANOVA with Tukey’s post hoc correction, ***P < 0.001, **P < 0.01). (G) TUNEL expressed as positive cells per number of alveoli after 48 hours of hyperoxia or room air (n = 2 per group for room air and n = 7 per group for hyperoxia, ANOVA with Tukey’s post hoc correction, **P < 0.01). (H) Representative image of TUNEL-stained lungs (original magnification, ×40; arrows highlight positive cells). (I) BALF protein levels from B6.Cg-Lepob/J (ob/ob) mice and heterozygous controls (ob/+) after 48 hours of exposure to >95% oxygen or room air (mg/mL, n = 3 per group for room air and n = 8 per group for hyperoxia, ANOVA with Tukey’s post hoc correction, **P < 0.01). Data are expressed as mean ± SEM.

