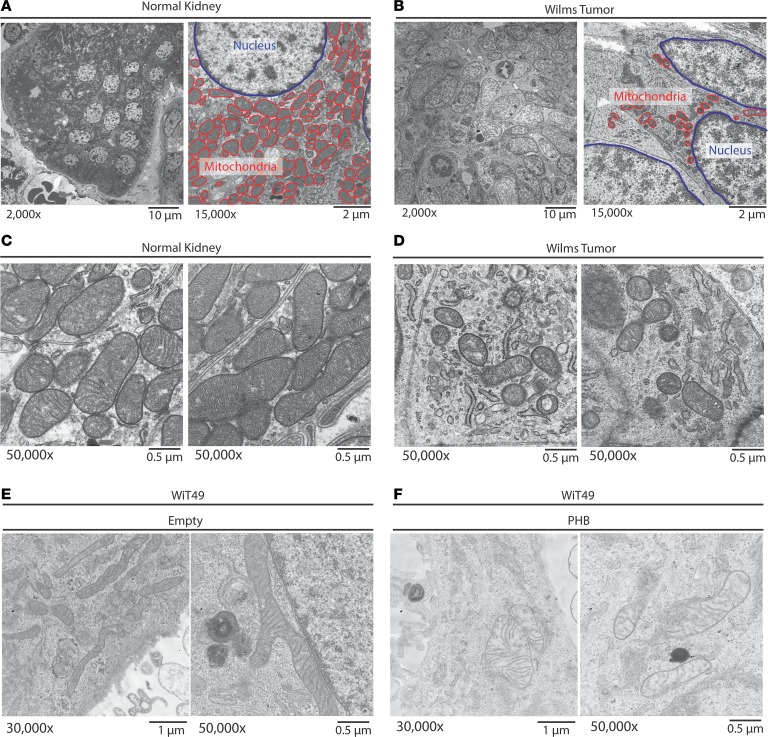
Figure 10. Primary Wilms’ tumor samples exhibit fewer mitochondria and predominantly a mitochondrial fission phenotype, as compared with adjacent normal kidneys.
(A–D) Untreated favorable-histology Wilms’ tumor was immediately fixed following nephrectomy and imaged using a transmission electron microscope to evaluate mitochondrial morphology. The normal kidney (original magnification, ×2,000 [A, left]; ×50,000 [C]) is compared with the Wilms’ tumor (original magnification, ×2,000 [B, left]; ×50,000 [D]). A and B also highlight (original magnification, ×15,000, right) the size and number of the mitochondria (red) as compared with the nucleus (blue). (E and F) Characteristic mitochondria of Wilms’ tumor cells (WiT49) treated with an empty vector (E) compared with a PHB overexpressing vector (F).

