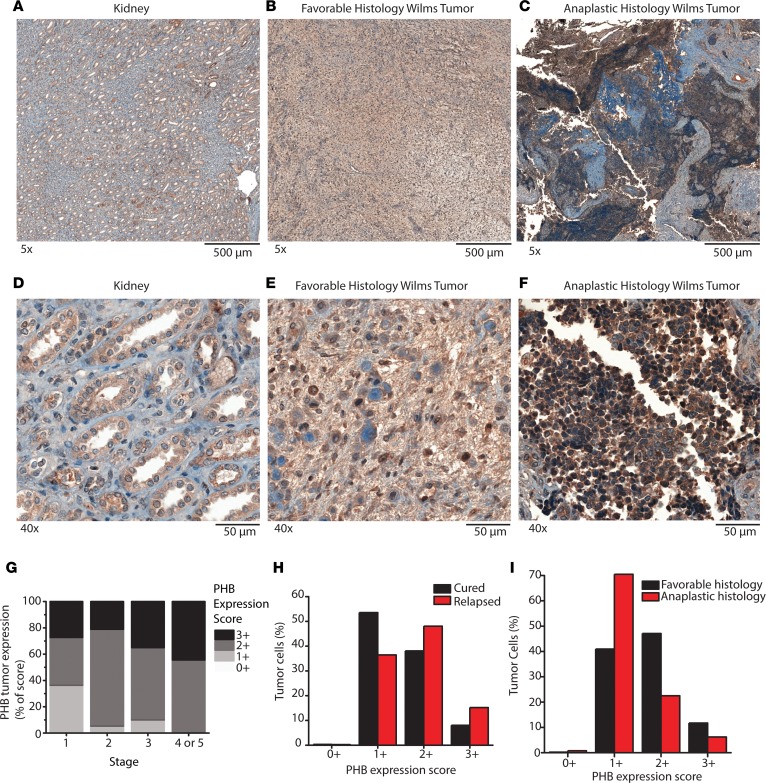
Figure 3. Prohibitin is highly expressed in primary Wilms’ tumor samples.
(A–F) PHB IHC staining was performed on formalin-fixed paraffin-embedded primary Wilms’ tumor samples and compared with adjacent normal kidneys. Original magnification, ×5 (A–C); ×40 (D–F). A and D include normal kidney. B and E include favorable-histology Wilms’ tumor. C and F include anaplastic histology Wilms’ tumor. (G) IHC was performed on a tissue microarray containing 59 primary Wilms’ tumor samples and graded from 0+ to 3+ in a blinded manner. Quantification of IHC from the tissue microarray is shown and stratified by initial tumor stage. (H and I) A second cohort of 38 patients with primary Wilms’ tumor was assessed (15 cured, 16 relapsed, 7 no information; 24 favorable, 14 anaplastic Wilms’ tumor). The expression of PHB was evaluated on a cell-by-cell basis using Halo imaging analysis software. A total of 24,862,509 cells were counted and scored from 0+ to 3+ based on PHB expression. In H, PHB expression in the cells of Wilms’ tumor that ultimately relapsed are compared with those that were cured. Whereas in I, PHB expression in the cells of Wilms’ tumor that had favorable histology are compared with those with anaplastic histology.

