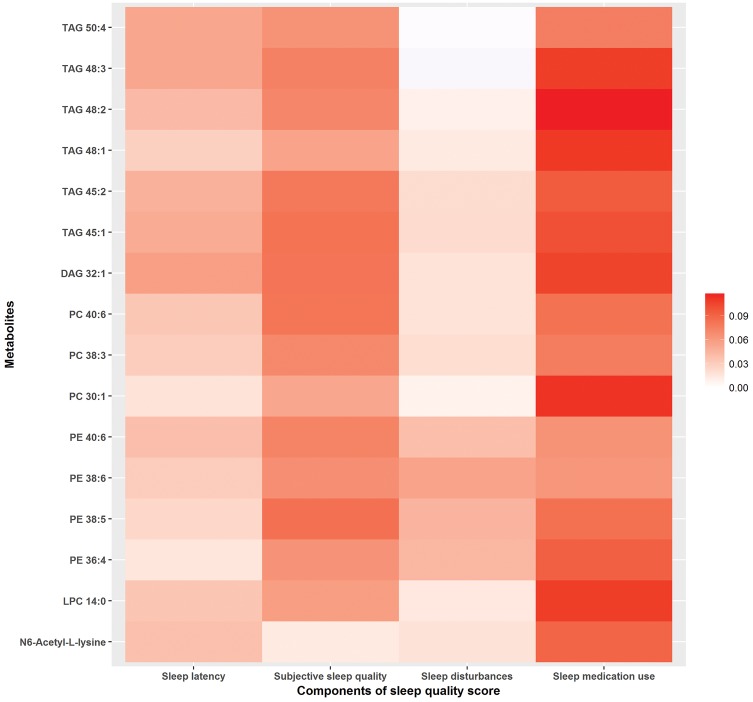
Figure 2.
Differences in metabolite z-score for every 1-point increase in the sleep-quality score (SQS) component. Metabolites presented in the figure include 16 metabolites replicated across WHI and NHSII. The colour indicates the magnitude of the beta coefficients for each SQS component from linear-regression models adjusted for age, race/ethnicity, BMI and current smoking status.

