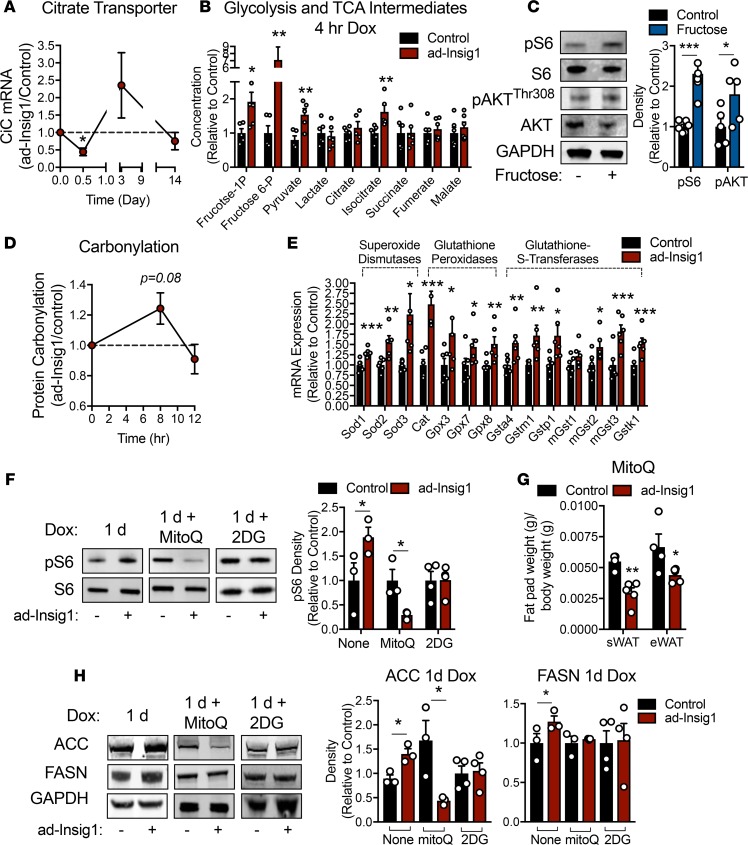
Figure 4. Acute suppression of AT DNL induces mitochondrial oxidative stress, resulting in mTORC1 activation.
(A) mRNA expression in sWAT of the citrate transporter (CiC) over the indicated dox treatment duration (n = 8–12). (B) Mice were injected with dox (2 mg/kg). At 3.5 hours after injection mice were gavaged with 1:1 glucose/fructose. At 4 hours after dox injection sWAT was harvested for determination of glycolytic and TCA cycle intermediate concentrations. (C) Wild-type mice were treated with and without 20% fructose in the drinking water for 12 hours. A representative Western blot and densitometry for pS6Ser240/244 and pAKTThr308 in sWAT (n = 5) are shown. (D) Protein carbonylation blot densitometry over the indicated time course of dox exposure (n = 4). (E) qPCR analysis of antioxidant genes in sWAT 8 hours after an injection of 2 mg/kg dox (n = 6). (F and H) Control or ad-Insig1 mice were injected with 5 mg/kg MitoQ or 250 mg/kg 2-DG and simultaneously supplied dox-supplemented diet for 24 hours. (F) Representative Western blot and densitometry of pS6Ser240/244 from the sWAT of control or ad-Insig1 mice treated with or without MitoQ or 2-DG (n = 3–4). (G) AT depots weights with MitoQ treatment. (H) An example Western blot for ACC and FASN levels in sWAT from control or ad-Insig1 mice treated with MitoQ or 2-DG and corresponding densitometry (n = 3–4). In this instance FASN was run on a separate gel from ACC and GAPDH although the biological sample presented is consistent. All data are presented as mean ± SEM. *P < 0.05, **P < 0.01, ***P < 0.001 by 2-tailed Student’s t test. In all cases, for a given condition, representative Western blot images are from the same sample, although the target proteins may have been probed on separate membranes to facilitate clear visualization. All densitometry was conducted on samples run on the same gel.

