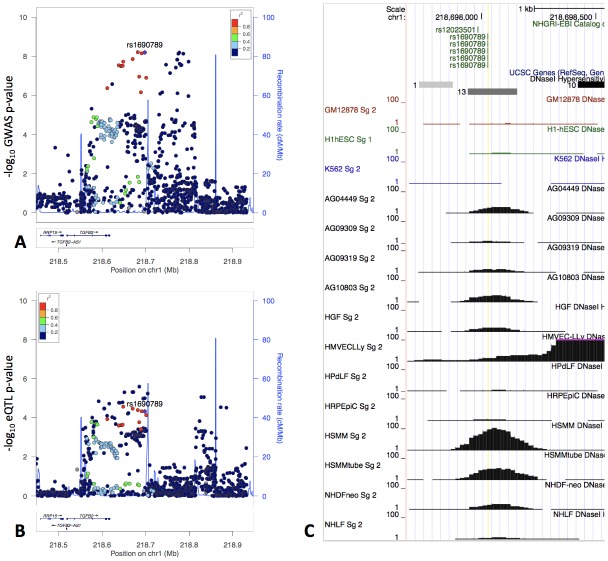
Figure 5. The locus zoom plot of GWAS p-values suggests two independent associations (Panel A), and the GWAS signal colocalizes with an eQTL signal in fibroblasts from GTEx (Panel B).
rs1690789 is located at one of these GWAS association peaks and lies within a context-specific DNaseI peak (Panel C). GM12878, H1hESC, and K562 cell lines are shown for reference, and the remaining cell types are those with DNaseI peaks that overlap rs1690789. Raw DNaseI data from only one experimental replicate are shown. GM12878 = lymphblastoid cell line. H1hESC = human embryonic stem cell. K562 = leukemia cell line. AG0449-AG10803 refer to fibroblasts from different subjects and sampling sites. HGF = gingival fibroblasts. HMVECLLy = lung derived microvascular endothelial cells. HPdLF - Periodontal ligament fibroblasts. HRPEpiC – retinal pigment epithelial cells. HSMM – skeletal muscle myoblasts. NHDF – dermal fibroblasts. NHLF – lung fibroblasts.

