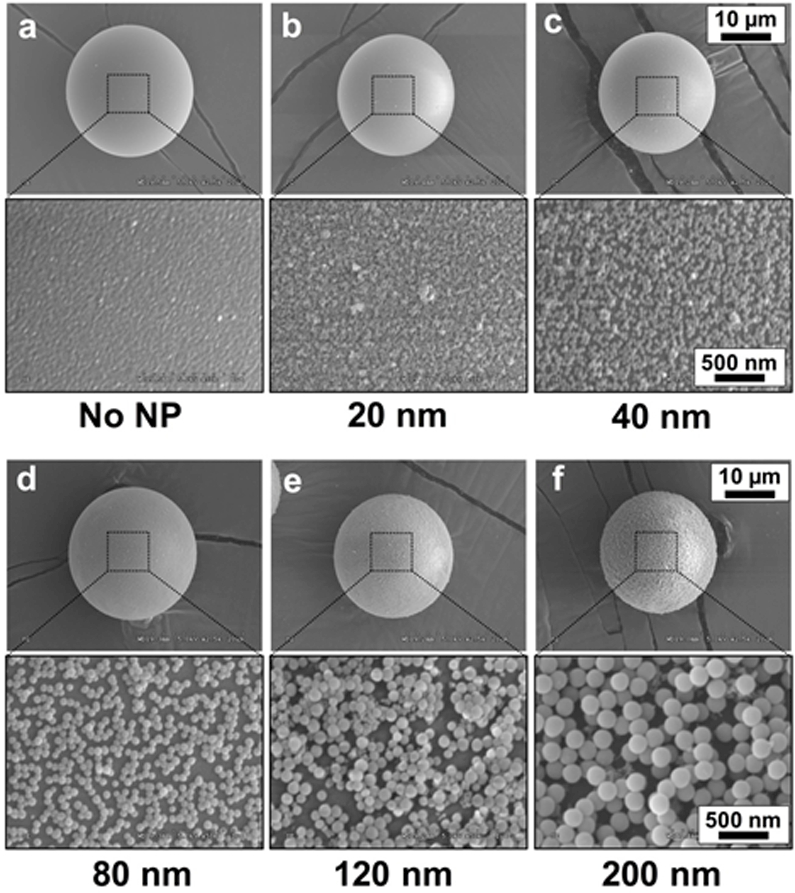
Figure 2.

SEM images of NSHGMS. The surface of HGMS was covered by SiO2 NPs with various sizes using LbL assembly process. (a) no SiO2, (b) 20 nm, (c) 40 nm, (d) 80 nm, (e) 120 nm and (f) 200 nm. The scale bar is 10 µm in the first and third rows, and 500 nm in the second and forth rows.
