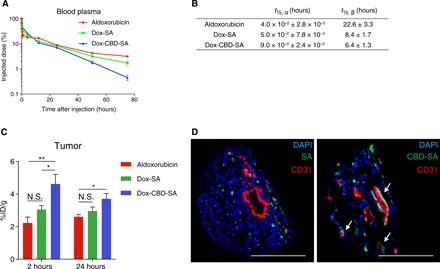
Fig. 2. Dox-CBD-SA shows comparable plasma pharmacokinetics with Dox-SA and higher tumor accumulation than aldoxorubicin and Dox-SA.

(A) Aldoxorubicin, Dox-SA, or Dox-CBD-SA (5 mg/kg on a Dox basis) was administered to tumor-free FVB mice via tail vein injection. Blood plasma was collected at the indicated time points. Plasma concentration of Dox was measured by fluorescence (mean ± SEM; n = 4 for aldoxorubicin, n = 5 for Dox-SA and Dox-CBD-SA). (B) Plasma half-lives of Dox were calculated using two-phase exponential decay: MFI (t) = Ae−αt + Be−βt. t½, α, fast clearance half-life; t½, β, slow clearance half-life (mean ± SEM; n = 4 for aldoxorubicin, n = 5 for Dox-SA and Dox-CBD-SA). (C) MMTV-PyMT tumor-bearing mice were treated with aldoxorubicin, Dox-SA, or Dox-CBD-SA (4.16 mg/kg on a Dox basis). At the indicated time points, tumors were harvested, and the amount of Dox within the tumors was quantified (mean ± SEM; n = 5 for 2 hours, n = 7 for 24 hours per group). (D) DyLight 488–labeled SA (100 μg) or equimolar amounts of DyLight 488–labeled CBD-SA were injected intravenously to MMTV-PyMT tumor-bearing mice. One hour after injection, tumors were harvested and fluorescence was analyzed by confocal microscopy. Tissues were also stained with 4′,6-diamidino-2-phenylindole (DAPI) and anti-CD31 antibody. Scale bars, 100 μm. Representative images of three tumors each. Two experimental replicates. Statistical analyses were done using analysis of variance (ANOVA) with Tukey’s test. *P < 0.05; **P < 0.01; N.S., not significant.
