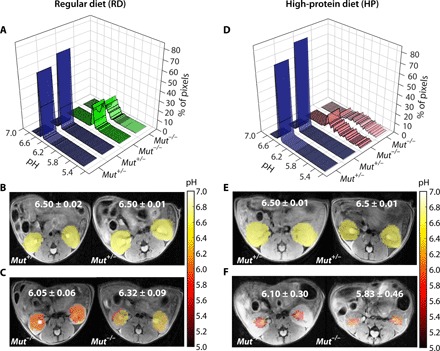
Fig. 5. In vivo pH results of two groups of mice maintained on RD and HP diets.

(A) pH histograms calculated for two representative RD Mut+/− and two representative RD Mut−/− mice. For Mut+/− mice (n = 5), more than 80% of the detected pixels display pH = 6.50, whereas for RD Mut−/− mice (n = 4), an acidic pH of 6.05 to 6.32 was observed for >20% of the kidney pixels. (B and C) Time-averaged pH maps of these RD Mut+/− and RD Mut−/− mice. The average pH dropped to 6.05 to 6.32 for RD Mut−/− compared to 6.50 for RD Mut+/− controls. The pH ranges of RD Mut−/− mice were ±0.06 and ±0.09 pH units compared to ±0.02 and ±0.01 pH units for RD Mut+/− mice. (D) pH histograms calculated for two representative HP Mut+/− mice and two representative HP Mut−/− mice. For HP Mut+/− mice, more than 80% of the detected pixels display a mean pH of 6.50, whereas for HP Mut−/− mice (n = 3), an acidic mean pH of 6.10 to 5.83 was observed. (E and F) Time-averaged pH images of Mut+/−and Mut−/− controls of HP mice. pH was further lowered to 5.83 for the most severely diseased mice. The pH was distributed over a narrow range of 6.50 ± 0.02 for both RD and HP Mut+/− mice, while this range significantly increased to ±0.30 and ±0.46 along with a decrease in mean pH for HP Mut−/− mice. A linear correlation was observed for RD and HP Mut−/− mice between ΔpH and mouse weight with R = 0.85 (fig. S9D).
