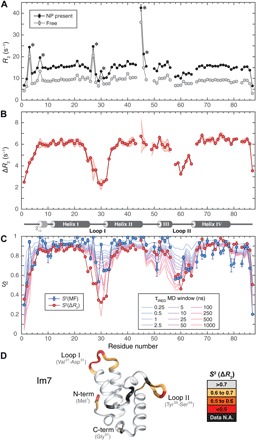
Fig. 2. Dynamics of Im7 protein by backbone 15N-NMR spin relaxation and molecular dynamics (MD) simulations.

(A) 15N-R2 relaxation rates measured in the absence (gray) and presence (black) of NPs. Data points with asterisks (*) indicate substantial chemical exchange Rex effects. (B) R2 differences (ΔR2) of (A) with secondary structure of Im7 indicated at the bottom (4 α helices and 310 helix at N terminus). Experimental uncertainty (1 SD) is depicted by the shaded red area based on five independently measured ΔR2 profiles (see fig. S6). (C) Comparison of ΔR2-derived S2 (red circles) with standard model-free S2 order parameters (blue circles) and S2 values determined from 1-μs MD trajectory with variable averaging time window (from 250 ps to 1 μs). (D) S2(ΔR2) values mapped on three-dimensional (3D) crystal structure [Protein Data Bank (PDB) code 1AYI] show loops and tails that undergo substantial dynamics on pico- to microsecond time scales. N.A., not available.
