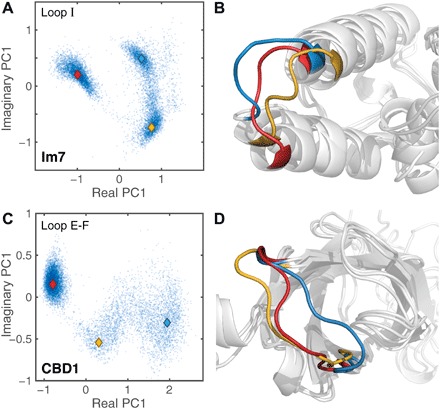
Fig. 4. Visualization of complex loop motions by 1-μs MD trajectories.

(A and C) Backbone dihedral angle–based PCA score plots of (A) Loop I of Im7 and (C) Loop E-F of CBD1 display multiple distinct conformational loop clusters. (B and D) 3D visualization of three cluster centers for each protein indicated by colored diamond (♦) symbols in score plots.
