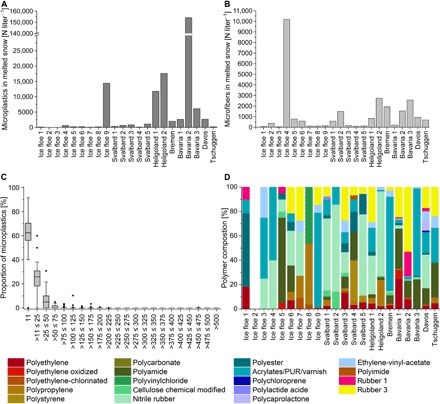
Fig. 2. Particles detected in snow samples collected at different locations from Europe to the Arctic.

(A) MP particle quantities recorded by FTIR at different locations. (B) Concentrations of microfibers detected at different locations (note that no polymers were identified). (C) Box-and-whiskers plot of proportions of MP numbers in different size classes from all snow samples. The upper and lower boundaries of the box indicate the 75th and 25th percentiles, respectively. The line within the box marks the median, error bars (in µm) indicate the 90th and 10th percentiles, and black diamonds represent outliers. (D) Relative composition of polymers identified by FTIR at different locations.
