
Fig. 2. ACV release from DECON is triggered by the addition of virus.
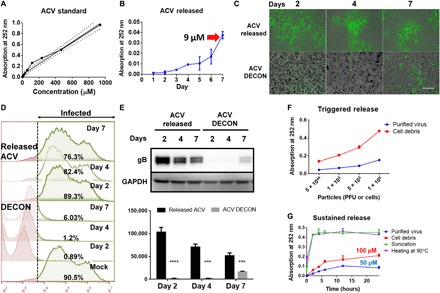
ACV (100 μg) dissolved in dimethyl sulfoxide (DMSO) was added to 1 ml of HPAC (1 mg/ml) and incubated overnight to estimate drug loading. (A) ACV standard curve generated by ultraviolet (UV) absorbance at 252 nm. (B) ACV release from HPAC was measured by dispersing DECON in minimum essential medium (MEM) at 1 mg/ml dilution for 7 days, and readings were taken every day to estimate the amount of ACV release from DECON. (C) DECON was dispersed in seven individual tubes containing MEM at 1 mg/ml dilution and incubated at 37°C. Each day for 7 days, a single tube was taken and centrifuged at 14,000g for 5 min. Two microliters of the supernatant was used to estimate ACV concentration via a UV spectrometer. Five hundred microliters of the supernatant was overlaid on HSV-1–infected HCEs to test the antiviral efficacy. DECON pellet was washed and dispersed in fresh 1-ml MEM before adding it to the HSV-1–infected cells. Representative fluorescence images of HSV-1–infected cells treated with the supernatant (top) or DECON pellet (bottom) on days 2, 4, and 7. Green represents 17 GFP HSV-1 virus. Scale bar (similar for all images), 100 μm. (D) Flow cytometry was conducted on the aforementioned experiment. Briefly, HCEs infected with HSV-1 17 GFP virus were overlaid with either released ACV or ACV-loaded DECON taken on either day 2, 4, or 7. Twenty-four hours after infection, cells were washed, resuspended, and fixed with 4% paraformaldehyde before they were analyzed through a BD Accuri C6 flow cytometer. Noninfected (GFP-negative) cells were used as negative control and infected-nontreated (GF-positive) cells were used as positive control. The panel on the right side indicated in green color represents the number of cells infected in each treatment group. X-axis indicates fluorescence. Cells to right of dashed line show fluorescence exceeding that of negative controls. (E) Representative immunoblots (top) and quantification (bottom) from samples treated with supernatant or DECON pellet on respective days. ***P < 0.001; ****P < 0.0001. (F) Varying concentrations of purified virus and cell debris were added to fresh DECON (1 mg/ml) to estimate whether they triggered ACV release from DECON. Samples were incubated at 37°C for 15 min before they were centrifuged, and UV absorbance readings were recorded at 252 nm on the supernatants to estimate ACV release from DECON. (G) Burst and sustained release profiles for DECON. DECON dispersed at 1 mg/ml in MEM was either sonicated, heated at 90°C for 5 min, or incubated with purified virus or cell debris. ACV release was estimated using the supernatants from these samples for a period of 24 hours.