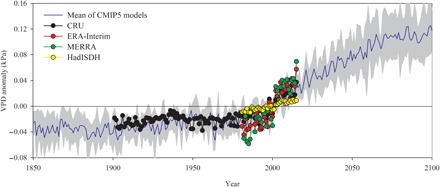
Fig. 1. Global mean vapor pressure deficit (VPD) anomalies of vegetated area over the growing season.

Anomalies are relative to the mean of 1982–2015 when data from all datasets are available. Vegetation areas were determined using the MODIS land cover product. Blue line and gray area illustrate the mean and SD of VPD simulated by six CMIP5 models under the RCP4.5 scenario.
