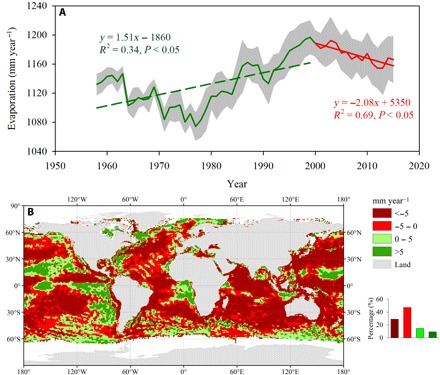
Fig. 2. Comparison of oceanic evaporation (Eocean) trends during the two periods of 1957–1998 and 1999–2015.

(A) Time series of globally averaged oceanic evaporation. (B) Spatial pattern on differences of oceanic evaporation trends between 1999–2015 and 1957–1998. Gray shaded area in (A) indicates ±1 SD. The inset in (B) shows the frequency distributions of the corresponding differences.
