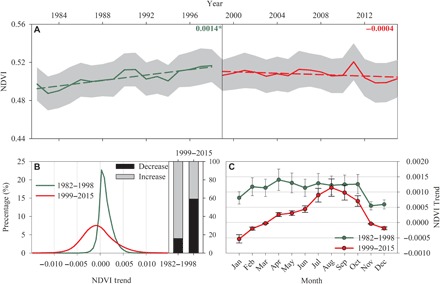
Fig. 3. Comparisons of NDVI trends over the globally vegetated areas from 1982 to 2015.

(A) Time series of NDVI. The numbers show the change rates of NDVI, and * indicates the significant changes at a significance level of P < 0.05. (B) Probability density function of NDVI trends during the two periods, with bars indicating the proportion of increased (gray) and decreased (black) responses. (C) Mean monthly NDVI trends between the two periods. Shaded area in (A) and error bars in (C) indicate ±1 SD.
