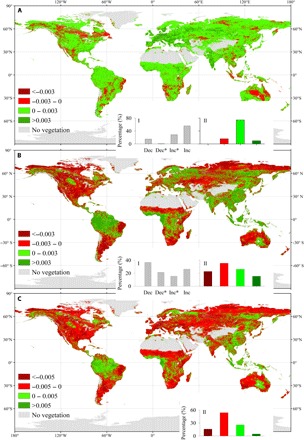
Fig. 4. Comparison of NDVI trends over the globally vegetated areas between two periods of 1982–1998 and 1999–2015.

(A) NDVI trend of 1982–1998. (B) NDVI trend of 1999–2015. (C) Differences of NDVI trend between 1999–2015 and 1982–1998. The insets (I) show the relative frequency (%) distribution of significant decreases (Dec*; P < 0.05), decreases (Dec), increases (Inc), and significant increases (Inc*), and the insets (II) show the frequency distributions of the corresponding ranges.
