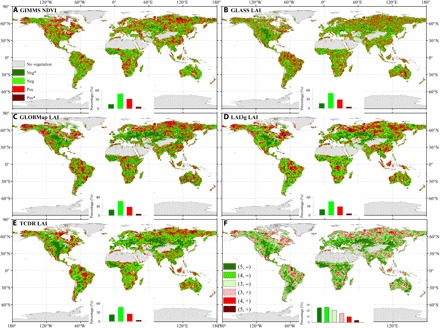
Fig. 5. Spatial patterns of correlations between VPD and satellite-based NDVI/LAI.

Partial correlations between detrended CRU VPD and detrended satellite-based NDVI/LAI were shown: GIMMS NDVI (A), GLASS LAI (B), GLOBMap LAI (C), LAI3g LAI (D), and TCDR LAI (E) during 1982–2015 (GLOBMap and LAI3g from 1982–2011). The insets in (A) to (E) show the relative frequency (%) distribution of significant negative correlations (Neg*; P < 0.05; dark green), negative correlations (Neg; light green), positive correlations (Pos; light red), and significant positive correlations (Pos*; P < 0.05; dark red). (F) Number of satellite-based NDVI/LAI datasets with the same sign of correlation: e.g., (5, –) indicates that all five satellite-based NDVI/LAI datasets showed negative correlations with VPD.
