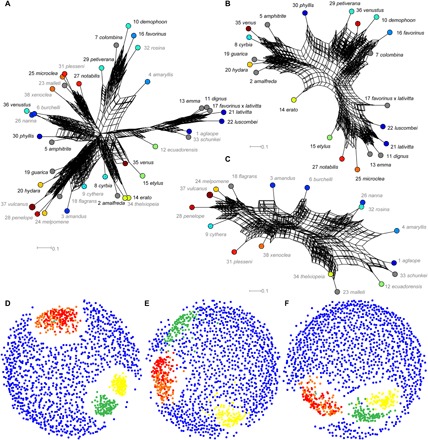
Fig. 1. Phylogenetic relationships between subspecies of H. erato and H. melpomene.

(A to C) Neighbor-joining consensus networks of phenotypic distance (eight sampled embedding axes, 100 replicates). (D to F) Tree space visualizations for phylogenies based on phenotype (orange and red, 32 embedding axes; red, hybrids excluded; cyan, 64 embedding axes), color pattern genes (green) (27), neutral genes (yellow), and randomized topologies (blue, 1000 replicates). (A and D) All subspecies. (B and E) Only H. erato. (C and F) Only H. melpomene. (A to C) Node label color indicates species (black, H. erato and gray, H. melpomene). Node colors show mimicry groups (tables S1 and S9). Node numbers show subspecies numbers (table S1).
