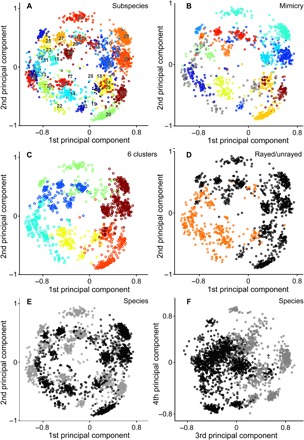
Fig. 2. Principal component visualization of phenotypic variation among Heliconius butterflies.

Principal component scores calculated for 2468 images of butterfly species H. erato and H. melpomene on the basis of image coordinates in a 64-dimensional phenotypic space, generated using a deep convolutional triplet network. Cumulative variance explained by displayed principal component axes: 1, 28%; 2, 50%; 3, 68%; and 4, 81%. (A) Butterfly subspecies 1 to 38 (Fig. 1 and table S7). (B) Twelve traditionally hypothesized (12) mimicry complexes (tables S1 and S9) of H. erato and H. melpomene subspecies (gray circles indicate nonmimics, not included in any of these mimicry complexes). (C) Six hierarchical clusters. (D) Two broad classes of type pattern for each subspecies (table S8), with orange rays (orange circles) or without rays (black circles). (E and F) Species, H. erato (black circles) and H. melpomene (gray circles).
