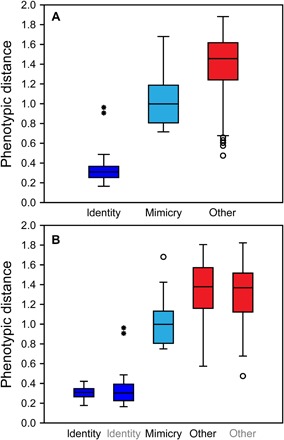
Fig. 3. Average pairwise Euclidean phenotypic distances between subspecies of H. erato and H. melpomene.

(A) Box plot of mean pairwise phenotypic distances (table S4) within subspecies (identity), between co-mimic subspecies (mimicry), and between all other subspecies (other). Sample sizes are 38, 19, and 684 subspecies pairs, respectively. (B) Separated species, H. erato (black labels, identity and other) and H. melpomene (gray) and interspecies co-mimics (mimicry). Sample sizes are 21, 17, 15, 209, and 133 pairs. Boxes show 25 to 75% quartiles; horizontal lines, medians; whiskers, inner fence within 1.5 × box height; circles and asterisks, outliers, respectively, within or beyond 3 × box height.
