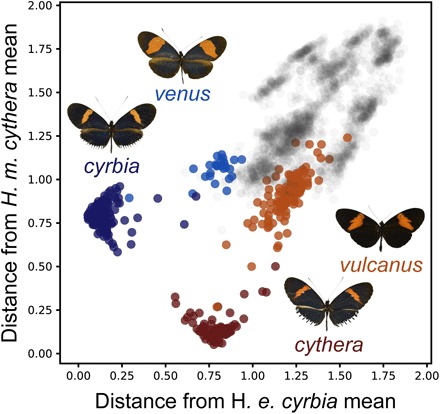
Fig. 4. Comparative analysis of the extent of phenotypic convergence in mimicry.

Case study from comparative analyses of 12 subspecies (fig. S7). The locations of two focal co-mimics (H. erato cyrbia, dark blue circles; H. melpomene cythera, dark red circles) in phenotypic space are compared alongside their nearest conspecifics (H. erato venus, light blue circles; H. melpomene vulcanus, light red circles). Subspecies are illustrated by dorsal photographs of the butterfly closest to the mean location for the subspecies. Gray circles indicate images of other subspecies in the dataset. Axes show the squared distance from the mean location of the focal co-mimic, summed across all 64 spatial embedding axes. Distance between subspecies means on the y axis, H. erato venus − H. erato cyrbia = 0.26. Distance between subspecies means on the x axis, H. melpomene vulcanus − H. melpomene cythera = 0.41.
