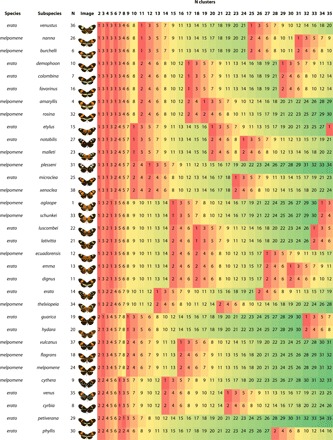
Table 1. Hierarchical clusters of subspecies from H. erato and H. melpomene calculated from the phenotypic spatial embedding.
Cluster membership is based on the modal specimen value for each subspecies after exclusion of hybrid specimens (table S2). Subspecies are illustrated by the dorsal photograph closest to the subspecies principal component analysis centroid (corresponding to Fig. 2A). N indicates subspecies number (table S1). Cluster numbers are colored by value to highlight divisions.

