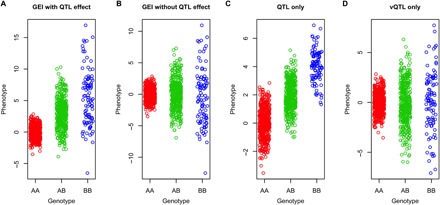
Fig. 1. Schematic of the differences in mean or variance among genotype groups in the presence of GEI, QTL, and vQTL effects.

The phenotypes of 1000 individuals were simulated on the basis of a genetic variant (MAF = 0.3) with (A) both QTL and GEI effects, (B) GEI effect only (no QTL effect), (C) QTL effect only (no GEI or vQTL effect), or (D) vQTL only (no QTL effect).
