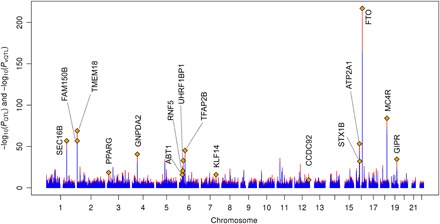
Fig. 4. Manhattan Sunset plot of genome-wide vQTL and QTL analyses for WC in the UKB.

Test statistics [−log10(P values)] of all common SNPs from vQTL (red bars) and QTL (blue bars) analysis are plotted against their physical positions. The top vQTL SNP is represented by an orange diamond, and the name of the nearest protein-coding gene is indicated for each significant vQTL locus (PvQTL < 2.0 × 10⁻⁹).
