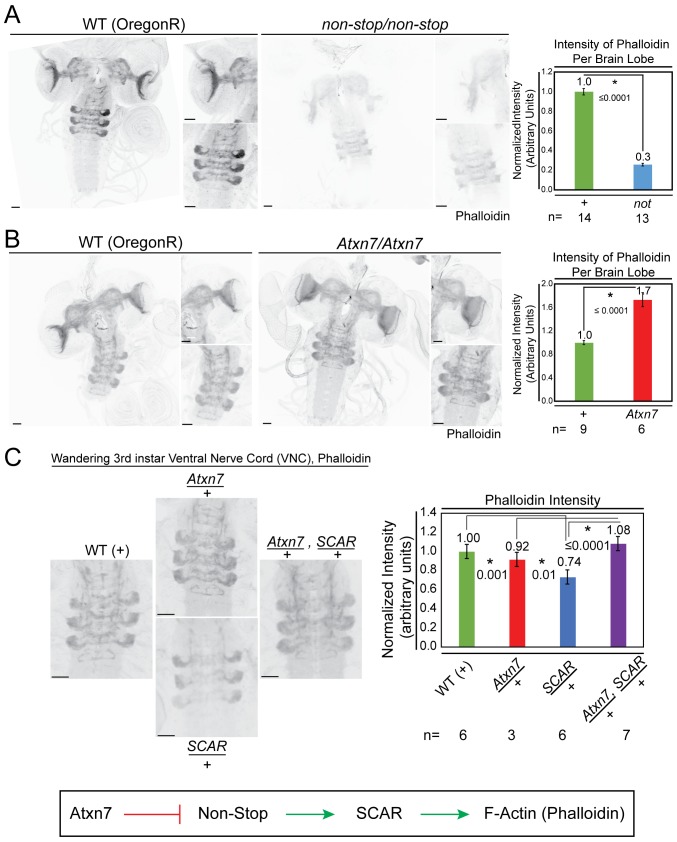
Figure 7. Atxn7 and Non-stop, act through the SCAR pathway in order to regulate the actin cytoskeleton in vivo.
(A) Phalloidin staining in third instar larval brains dissected from not02069 reveals a decrease in neural F-actin. (B) Conversely, phalloidin staining in Atxn7KG02020 shows an increase in F-actin. Microscope acquisition settings were identical to allow comparison. Scale bar is 50 µM. Charts show the averaged phalloidin fluorescence intensity measurements for individual brain lobes. Wild type average intensity was set to one and mutants were normalized to wild -type. A t-test was used to compare the samples and the p-value is shown and asterisks indicate significance. Error bars are standard error. (C) Phalloidin staining in wild type, Atxn7KG02020/+, SCAR[Δ37] /+, and Atxn7KG02020, SCAR[Δ37] /+, + third instar VNC shows that Atxn7 mutation can rescue the defects seen in SCAR heterozygotes. Scale bar is 20 µM. Fluorescence intensity was measured for each VNC. Wild-type average intensity was set to one and mutants were normalized to wild-type. Error bars are standard error. A t-test was used to compare the samples and significant values are listed with an asterisks and p-value. Line diagram outlines an explanation for these observations (bottom).

