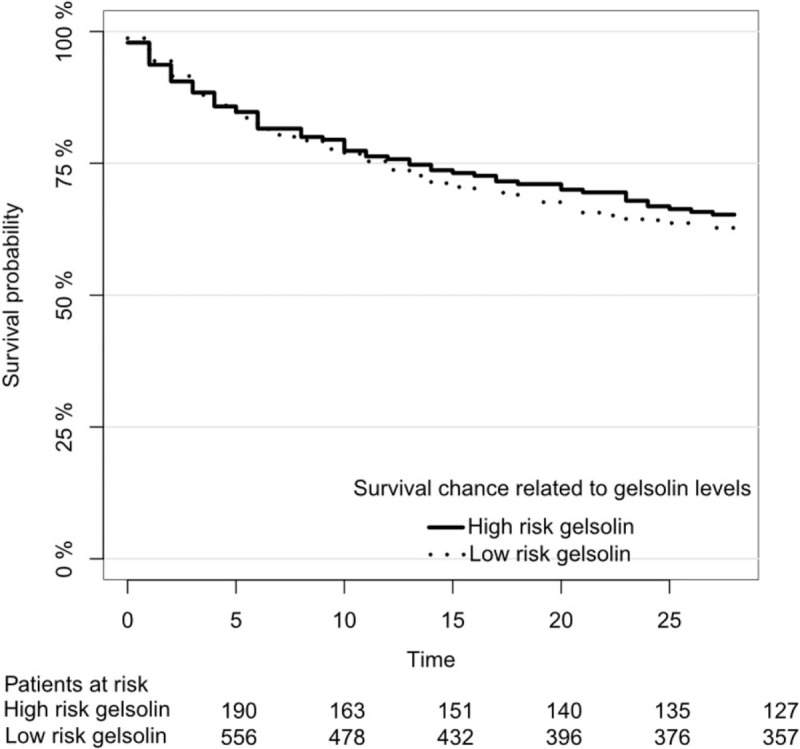
Fig. 3.
Kaplan–Meier curve showing mortality.

Kaplan–Meier curve showing mortality for patients with baseline gelsolin levels below the 25th percentile and patients with baseline gelsolin above the 25th percentile. There was no interaction between surgical origin and baseline gelsolin level below the 25th percentile (P = 0.71).
