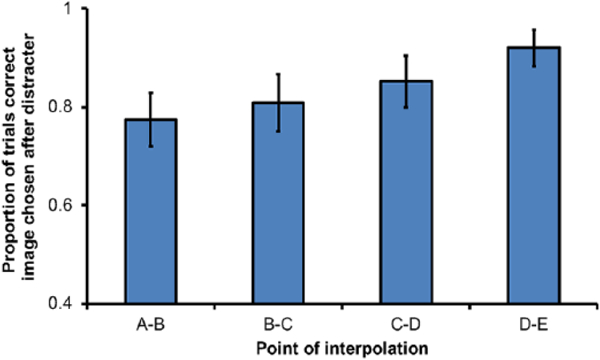
Figure 7.

Proportion of tests in which the correct image was chosen after the distracter dot in Experiment 3. Proportions reflect the number of trials in which the next correct images, B, C, D, and E, were selected after each respective point of interpolation, rather than entire list accuracy; error bars represent standard errors of the mean.
