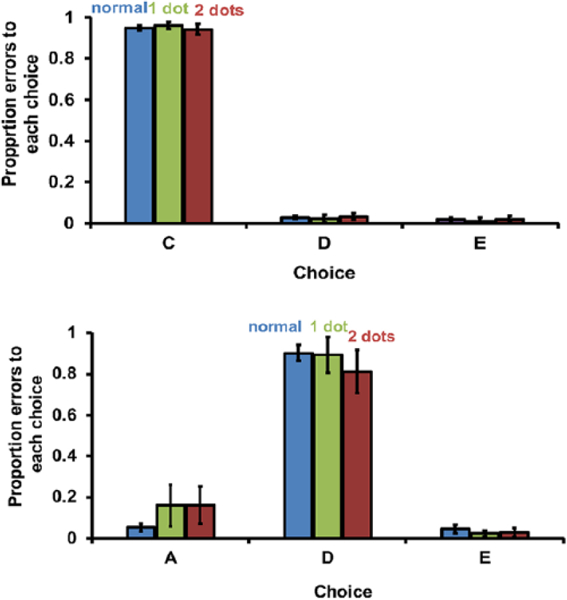
Figure 9.

Proportion of errors made on normal tests and probe tests. Blue bars (left-most) indicate normal trials; green bars (middle) indicate probe trials with one distracter dot; red bars (right-most) indicate probe trials with two distracter dots; distracter dots occurred in both probe types: either after image A (upper panel) or after image B (lower panel) in Experiment 4; in Panel A, for example, C is a +1 error and D is a +2 error; in Panel B, D is a +1 error, E is a +2 error, and A is a –2 error; error bars represent standard error of the mean.
