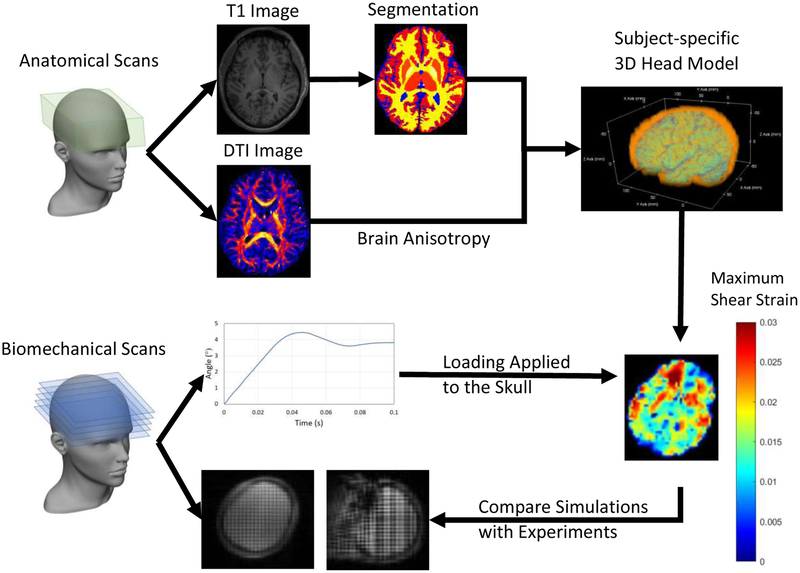
Figure 2.
Computational modeling procedure. The 3D head model was constructed based on T1 and DTI images. The initial angular velocity and angular position profile measured from experiments were served as loading conditions. The simulation results were compared with experimental results calculated from tagging images.

