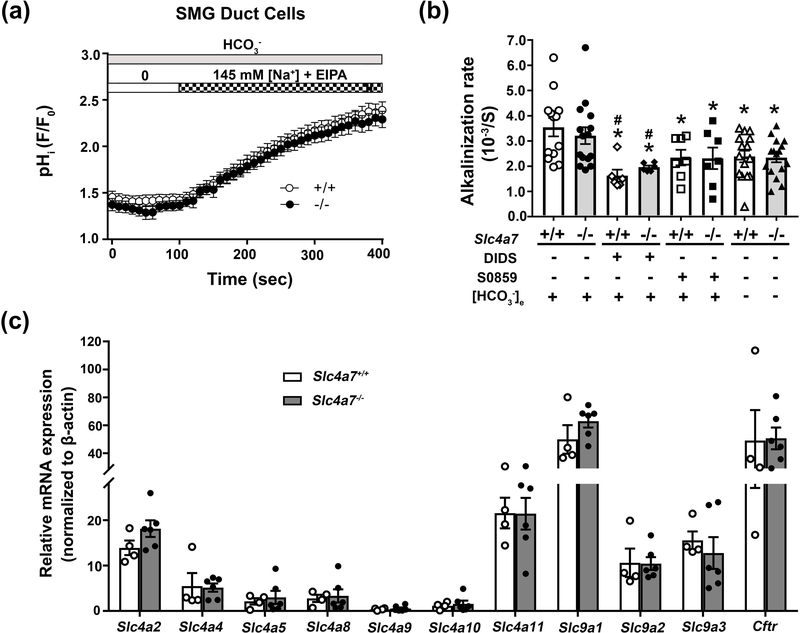
Figure 7.
Slc4a7 disruption fails to affect pHi regulation in SMG duct cells. Duct cells isolated from Slc4a7+/+ and Slc4a7−/− mouse SMG were loaded with the pH sensitive dye BCECF and the Na+ dependent intracellular pH (pHi) recovery monitored following an NH4+-prepulse induced intracellular acidosis. All solutions were Cl- free and contained 10 μM EIPA to block Cl-/HCO3- and Na+/H+ exchange, respectively. HCO3- containing and HCO3- free NH4+ solutions were Solutions E and H (Table 2), respectively. (a) The increase in the pHi observed in duct cells of Slc4a7−/− (black circles, n=15) and Slc4a7+/+ (white circles, n=13) mice was comparable when switched from Na+ free to Na+ containing HCO3- solutions (Solutions F and D, respectively, Table 2). (b) Summary of the alkalinization rates for experiments like those shown in panel 7a for SMG duct cells from either Slc4a7−/− (grey bars) or Slc4a7+/+ (white bars) mice. Values are shown for individual mice (HCO3− containing = circles; DIDS = diamonds; S0859 = squares; HCO3− free = triangles) along with the mean ± SEM of ducts isolated from at least six different mice. The alkalinization rate in a HCO3− containing solution for Slc4a7+/+ mice (white bar, white circles) was significantly greater (*, p<0.05) than in the presence of DIDS (white bar, white diamonds). Of note, the Na+ dependent alkalinization induced in SMG duct cells by switching from Solution F to D (Table 2) was only moderately sensitive to DIDS (100 μM) and S0859 (100 μM) or dependent on HCO3- (switching from Na+ free to Na+ containing HCO3- free solutions, Solution I to G, Table 2, HCO3− free in the presence of 30 μM carbonic anhydrase inhibitor EZA) [results not shown for 500 μM DIDS, alkalinization rate (10−3/S): 500 μM DIDS = 1.83 ± 0.40 (n = 7) and 2.12 ± 0.27 (n = 10) for Slc4a7+/+ and Slc4a7−/−, respectively; ANOVA test p>0.66]. (c) Summary of qPCR results for Slc4 (a2, a4, a5, a8, a9, a10 and a11), Slc9 (a1, a2 and a3) and Cftr, normalized to β-actin expression. Values are shown for individual SMG (white circles = Slc4a7+/+; black circles = Slc4a7−/−) along with the mean ± SEM of glands isolated from 4 Slc4a7+/+ and 6 Slc4a7−/− mice. Note break in Y axis for Slc9a1 and Cftr.

