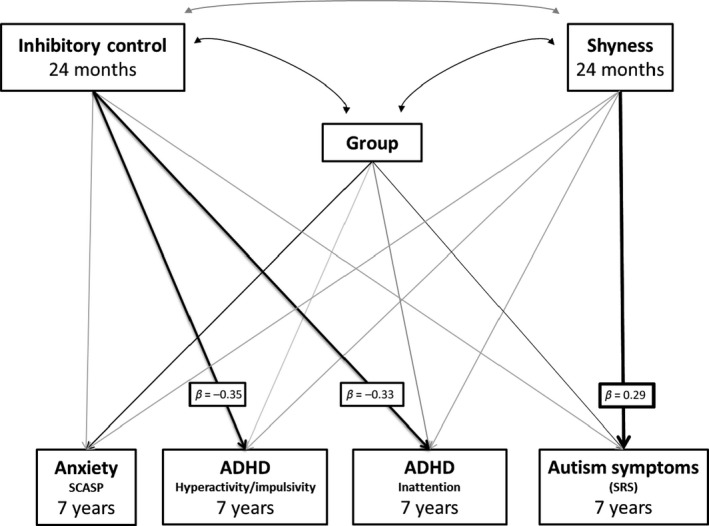
Figure 2.

Model 2a: Path analysis model showing associations between 24‐month inhibitory control and shyness and later symptoms of ADHD, ASD and anxiety. Black arrows indicate significant effects at p < .05. Grey arrows are nonsignificant effects. Key pathways of interest are in bold with standardised beta values attached. Correlations between symptoms of ADHD, anxiety and ASD were included in the model but are not shown in the diagram for simplicity
