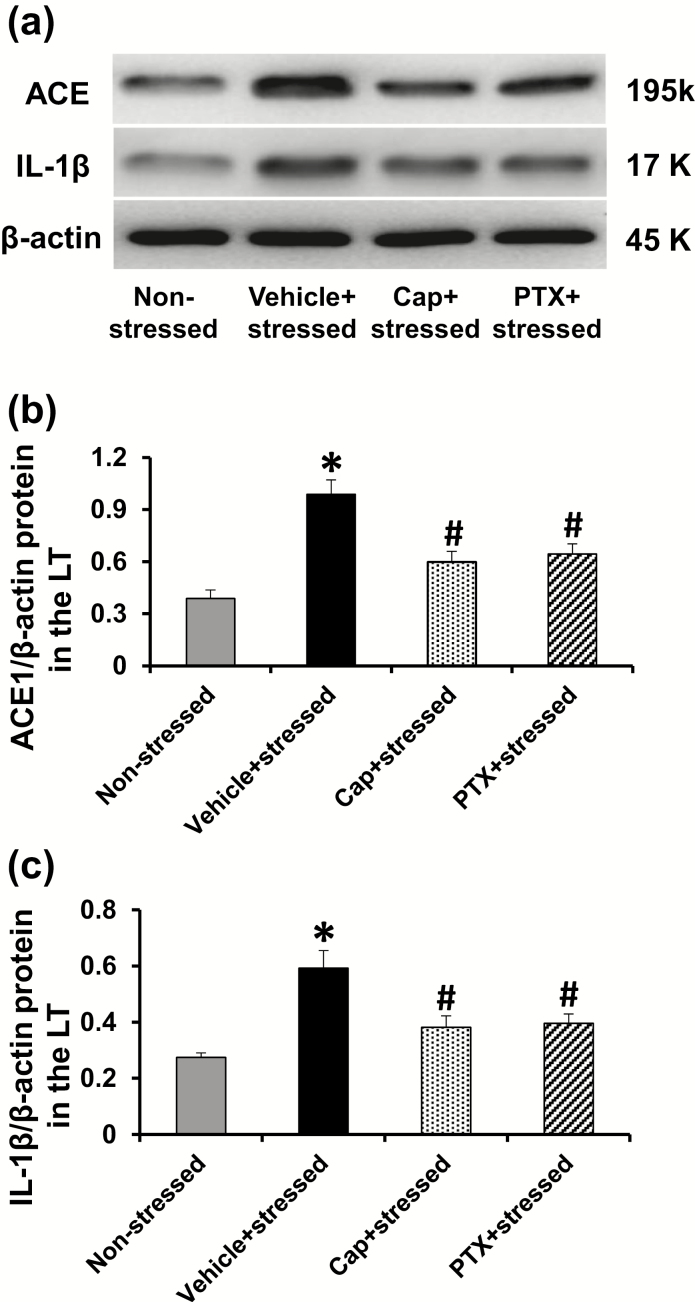
Figure 3.
Representative western blots and quantitative comparison of protein levels for ACE (a and b) and IL-1β (a and c) in the LT of nonstressed, stressed, stressed with pretreatment with either captopril (Cap) or pentoxifylline (PTX) rats before angiotensin II infusion. Values are corrected by β-actin and expressed as mean ± SEM (n = 5 per group; *p < .05 vs. nonstressed rats; #p < 0.05 vs. stressed rats without pretreatment).

