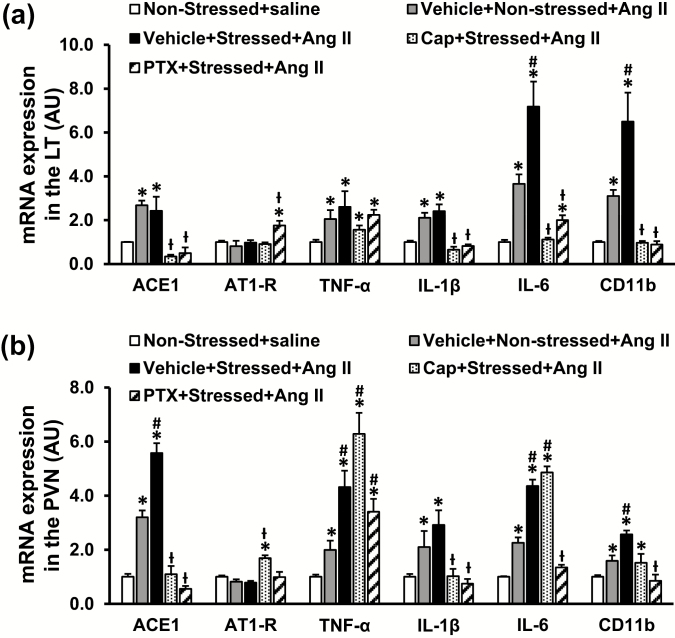
Figure 4.
Quantitative comparison of the mRNA expression of renin–angiotensin–aldosterone system components, proinflammatory cytokines, and microglial marker in the lamina terminalis (LT; a) and paraventricular nucleus (PVN; b) of nonstressed, stressed, stressed with pretreatment with either captopril (Cap) or pentoxifylline (PTX) rats after angiotensin (Ang) II administration (n = 6 per group; *P < 0.05 vs. nonstressed + saline; #P < 0.05 vs. nonstressed+Ang II; ƚP < 0.05 vs. stressed + Ang II).

