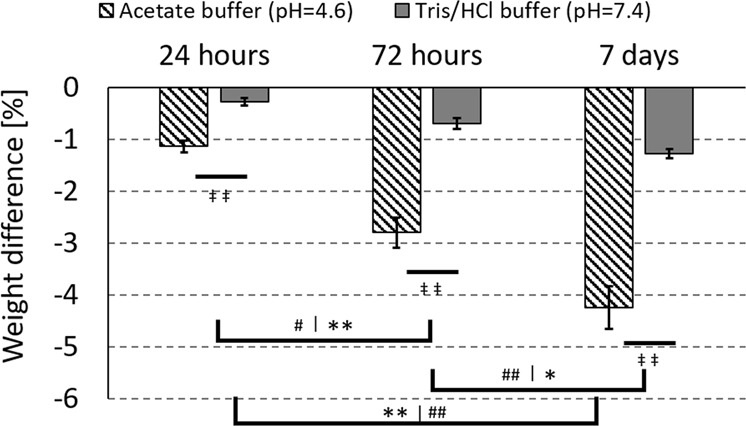
Fig. 3.

Significant weight loss of the BAG granules in physiological (Tris/HCl) and acidic (acetate) buffers, over time. The * indicates the difference over time in acetate buffer, the # indicates the difference over time in Tris/HCl buffer and the ‡ indicates the difference at the given time point between the two buffers. Single signs refer to a p-value < 0.05 and double signs refer to a p-value < 0.001
