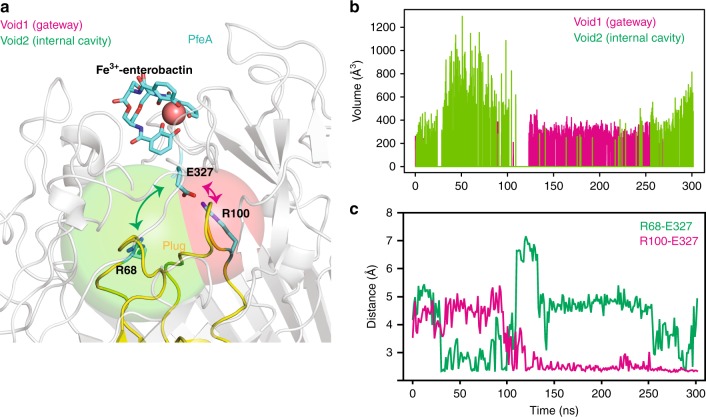
Fig. 7.
Voids identified by molecular dynamics simulations. a Molecular graphics illustrating gateway (magenta) and internal cavity (green) controlled by exchange of Glu327 salt bridging partners in the complex simulations. The NL1/NL3 loops of the plug region are in yellow and the rest of the protein is in white. b Time series of the size of the voids identified below the Fe3+-enterobactin-binding site of PfeA. We note that they are covering almost the entire trajectory. In some parts of the trajectory, a significant expansion of the internal cavity is observed. c Plug-Glu327 salt bridges that control the dynamical behaviour of the internal cavity. We observe the correlation between the volume expansion and breaking and forming of the Arg68-Glu327 salt bridge

