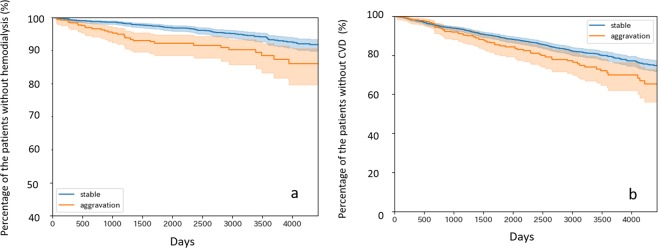
Figure 4.
Kaplan-Meier survival analysis for hemodialysis (a) and cardiovascular disease (CVD) (b) after the first visit in the stable and aggravation groups. (a) The blue line shows the percentage of patients without hemodialysis in the “Stable” group (n = 2,477) at each time point, while the red line shows that of the “Aggravation” group (n = 423). Log rank test result marked P = 0.00024. (b) The blue line shows the percentage of patients without a cardiovascular event in the “Stable” group (n = 2,367) at each time point, while the red line shows that of the “Aggravation” group (n = 407). Log rank test result marked P = 0.01434. In this study, cardiovascular events are defined as hospitalized heart failure, myocardial infarction, performance of coronary artery bypass grafting, percutaneous coronary intervention, and death due to heart disease. The shaded areas show 95% confidence interval.

