Figure 1.
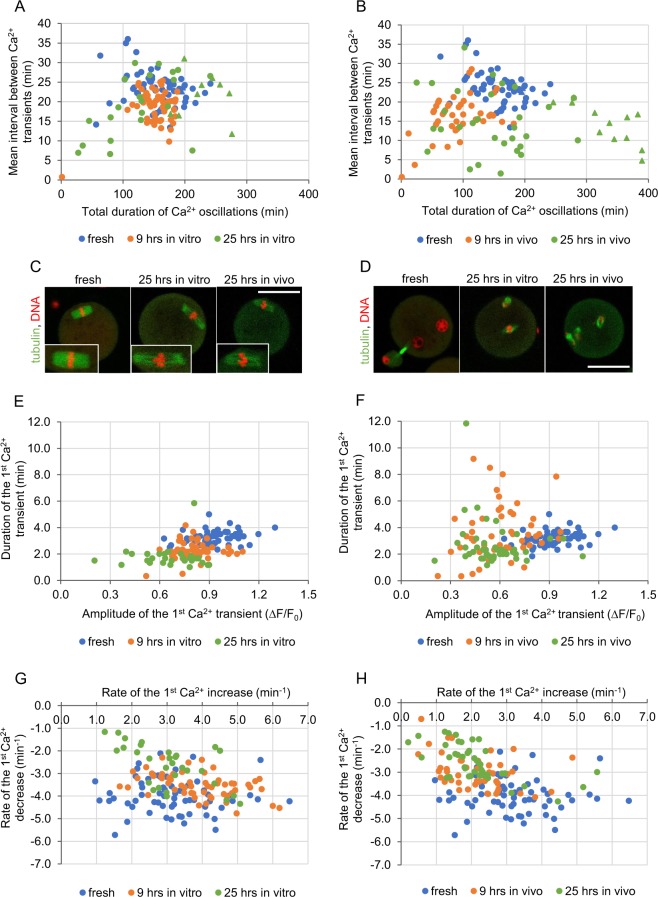
Fertilization-induced Ca2+ oscillations in postovulatory aged oocytes. (A,B) Point charts presenting the total duration of Ca2+ oscillations and the mean interval between Ca2+ transients in freshly ovulated oocytes, oocytes aged for 9 and 25 hrs in vitro (A) and in vivo (B). (C,D) Representative immunostainings (β-tubulin in green, DNA in red) of nuclear apparatus in unfertilized freshly ovulated and aged oocytes (C), and 6 hrs after fertilization of freshly ovulated and aged oocytes (D). Scale bar 50 µm. (E–F) Point charts presenting the amplitude and the duration of the 1st Ca2+ transient in freshly ovulated oocytes and oocytes aged for 9 and 25 hrs in vitro (E) and in vivo (F). (G–H) Point charts presenting the rates of Ca2+ increase and decrease during the 1st Ca2+ transient in freshly ovulated oocytes and oocytes aged for 9 and 25 hrs in vitro (G) and in vivo (H). (A,B, E–H) Each dot/triangle represents one oocyte, the number of analysed oocytes is included in Table 1. Triangles (in (A,B)) mark oocytes that did not finish Ca2+ oscillations during the filming.

