Figure 4.
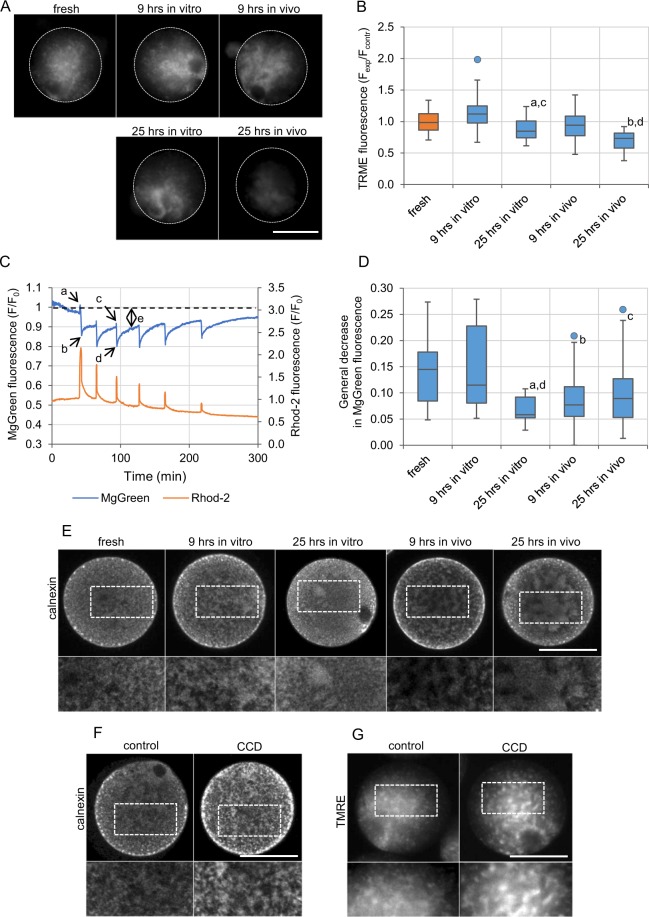
Functionality of mitochondria and distribution of organelles in postovulatory aged oocytes. (A) TMRE staining of active mitochondria in representative freshly ovulated oocytes and oocytes aged in vitro and in vivo for 9 and 25 hrs. The dashed white line marks oocytes’ circumferences. Scale bar 50 µm. (B) Mean intensity of TMRE staining (indicative of mitochondrial membrane potential) for the experimental variants depicted in (A) calculated for 43 freshly ovulated oocytes, 47 and 44 oocytes aged in vitro (for 9 and 25 hrs, respectively) and 58 and 53 oocytes aged in vivo (for 9 and 25 hrs, respectively). All intensity values were normalized with the mean fluorescence intensity calculated in the particular experiment for the control, freshly ovulated oocytes. ap < 0.05, bp < 0.001 vs. fresh oocytes, cp < 0.001 vs. 9 hrs in vitro, dp < 0.001 vs. 9 hrs in vivo. (C) Ca2+ (in orange; Rhod-2 fluorescence) and Mg2+ (in blue; MgGreen fluorescence) oscillations in a representative freshly ovulated oocyte. The cytoplasmic concentration of free Mg2+ ions is inversely proportional to the ATP concentration. Letters a-e indicate values used for further analysis of the fertilization-induced ATP production and presented in the graph (D) and Supplementary Fig. S6E,F. (D) General decrease in the Mg2+ concentration (value ‘e’ in (C)), indicative of general increase in the ATP production, calculated for 31 freshly ovulated oocytes, 24 and 10 oocytes aged in vitro (for 9 and 25 hrs, respectively), and 17 and 30 oocytes aged in vivo (for 9 and 25 hrs, respectively). ap < 0.01, bp < 0.05, cp = 0.05 vs. fresh oocytes, dp < 0.05 vs. 9 hrs in vitro. (B,D) Graphs present medians and the 1st and the 3rd quartile values. The ends of the whiskers are set at 1.5*IQR above the third quartile and 1.5*IQR below the first quartile. Dots show the minimum and maximum values if they are outside the range (outliers). (E-F) Immunofluorescence staining of calnexin, an ER marker, in representative freshly ovulated oocytes and oocytes aged in vitro and in vivo for 9 and 25 hrs (E), and in control and cytochalasin D (CCD)-treated oocytes (F). The dashed white line marks the zoomed regions. Scale bar 50 µm. (G) TMRE staining of active mitochondria in representative control and CCD-treated oocytes. The dashed white line marks the zoomed regions. Scale bar 50 µm.

