Figure 6.
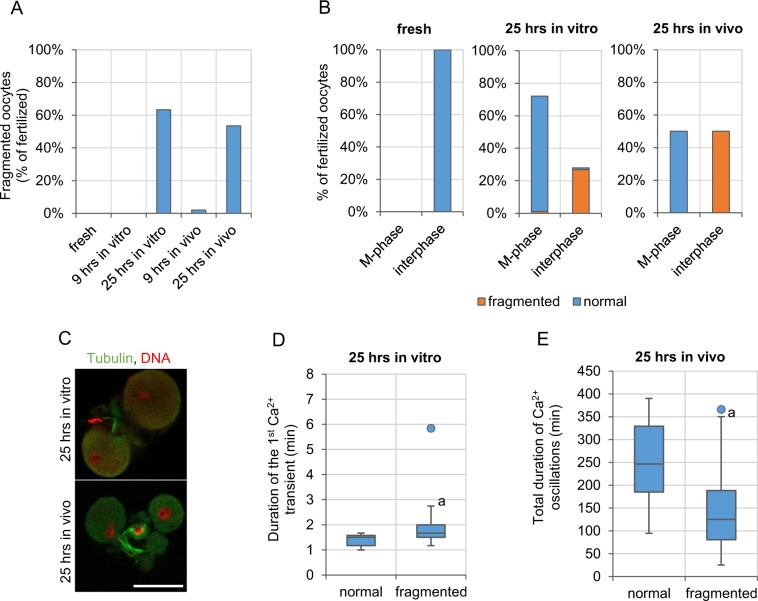
Developmental potential of postovulatory aged oocytes. (A) Frequency of fragmentation in fertilized freshly ovulated oocytes (n = 64) and oocytes aged for 9 and 25 hrs in vitro and in vivo (n = 57 and 30 and n = 51 and 43, respectively). (B) Percentage of oocytes arrested in metaphase II or activated (in interphase) among fertilized freshly ovulated oocytes and oocytes aged for 9 and 25 hrs in vitro and in vivo, and frequency, with which they undergo fragmentation. (C) Immunostaining (β-tubulin in green, DNA in red) or representative fragmented embryos derived from oocytes aged for 25 hrs in vitro and in vivo. Scale bar 50 µm. (D) The duration of the 1st Ca2+ transient in normal and fragmented embryos derived from oocytes aged for 25 hrs in vitro. (E) The total duration of Ca2+ oscillations in normal and fragmented embryos derived from oocytes aged for 25 hrs in vivo. (D,E) Graphs present medians and the 1st and the 3rd quartile values. The ends of the whiskers are set at 1.5*IQR above the third quartile and 1.5*IQR below the first quartile. Dots show the minimum and maximum values if they are outside the range (outliers). ap < 0.01 vs. normal, non-fragmented embryos.

