Fig. 1.
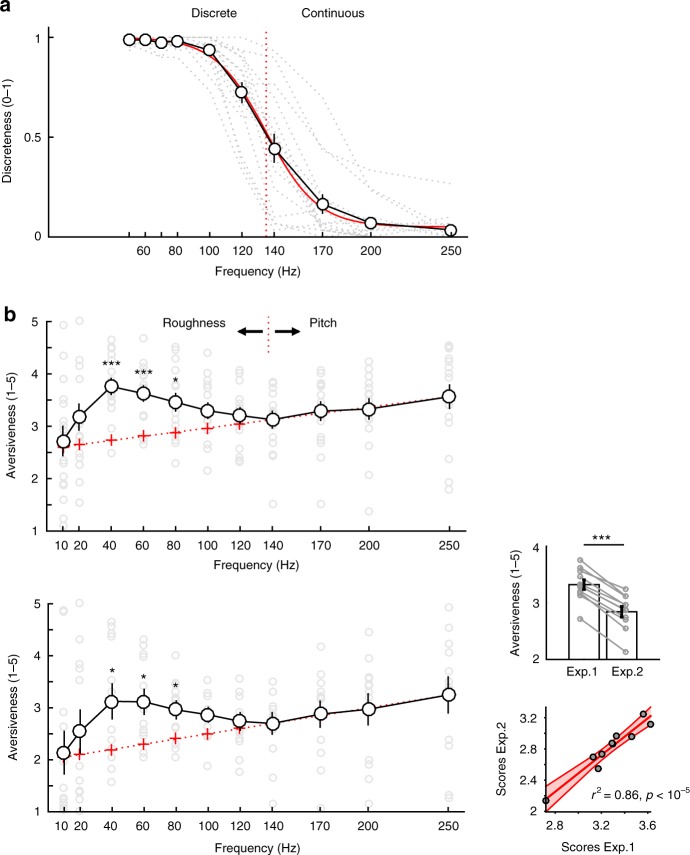
Temporal perceptual transition and subjective assessment of temporal salience. a Temporal discretisation limit experiment (Experiment 1). Averaged subjective reports of discreteness (1–discrete, 0–continuous) averaged across participants indicate that subjective percept switches from discrete to continuous around 130 Hz (red dotted line: 50% discreteness ratings), which roughly corresponds to the upper limit of the roughness acoustic attribute. The continuous red curve represents the sigmoidal fit to the average across participants. Dotted light grey lines correspond to individual data. b Temporal salience experiments. Top panel: Experiment 2a. Averaged subjective aversion (reported on a 1–5 scale) follows a nonlinear pattern. Above the discretisation limit (>130 Hz, i.e., in the pitch range), aversion is linearly proportional to the frequency (energy) of the stimulus. Below this limit, in the roughness range, subjective aversion follows a nonlinear profile and is maximal at 40 Hz. Divergence from linearity in the roughness range is measured as the difference with aversion values predicted by a linear extrapolation of averaged aversion values measured above the discretisation limit. Light grey circles correspond to individual data Bottom panel: Experiment 2b: independent replication of Experiment 2a using the same stimuli at lower intensity (50 dB SPL) in n = 12 additional participants. Upper right inset: Main effect of sound intensity between Experiments 2a and 2b. Grey data points correspond to stimuli frequencies. Lower right inset: correlation plot between averaged ratings at each frequency in Experiment 2a and 2b. Error bars indicate SEM. ** and *** indicate significant p-values at 0.01 and 0.001, FDR corrected

