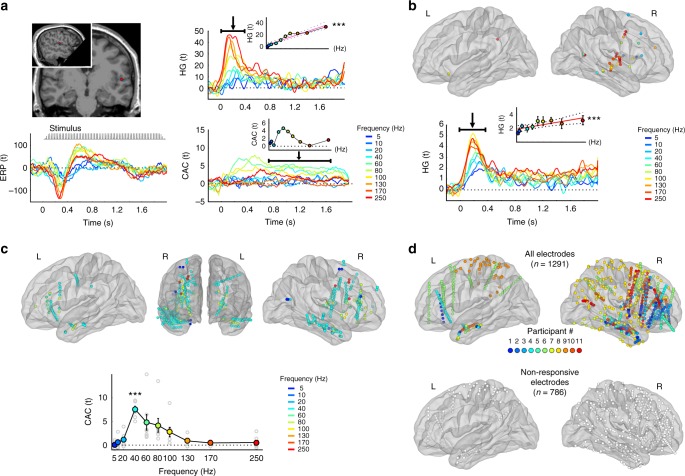
Fig. 2.
HG and CAC spatial response patterns differ across stimulation frequencies. a Neural responses to click trains in a representative electrode situated in the right primary auditory cortex (Heschl’s Gyrus) of patient S1. Lower left plot: time course of unfiltered event-related responses to the stimuli expressed in t-values relative to baseline. Responses are aligned with an exemplar of a stimulus (here a 40 Hz click train). Upper right plot: time course of high-gamma [HG, 70–200 Hz] amplitude in response to the stimulus, expressed in t-values relative to baseline, as a function of click train frequency (ranging from 5 Hz, blue to 250 Hz, red). HG onset [0–0.4 s] response is linearly proportional to the rate of the stimulus (upper inset). Lower right plot: magnitude squared stimulus-brain coherence (cerebro-acoustic coherence, CAC, expressed in t-values relative to baseline). CAC shows a sustained pattern through the duration of the stimulus that varies nonlinearly as a function of the stimulus rate and is prominent in the roughness range (40–100 Hz; lower inset). b–d Neural responses to click trains across all eleven patients. b Upper panel: spatial location of electrodes exhibiting significant HG onset responses to sounds. Colours represent the stimulation frequency at which HG response is maximal. Lower plot: time course of HG [70–200 Hz] responses averaged across these electrodes, expressed in t-values relative to baseline, as a function of stimulus frequency. HG amplitude at the response onset [0–400 ms] is linearly proportional to the rate of the stimulus (inset). c Electrodes showing sustained, significant stimulus-brain coherence (CAC) are spatially located in widespread cerebral areas. Colours represent the stimulation frequency at which CAC is maximal. Lower plot: CAC as a function of stimulus rate. Light grey circles correspond to individual data. d. Top panels: spatial location of all electrodes, colour-coded as a function of participant number. Lower panel: spatial location of electrodes that did not show any significant HG or CAC response. Error bars indicate SEM. Asterisks in panels a and b indicate significant correlation with stimulus frequency: *** indicates significant p-values at 0.001

