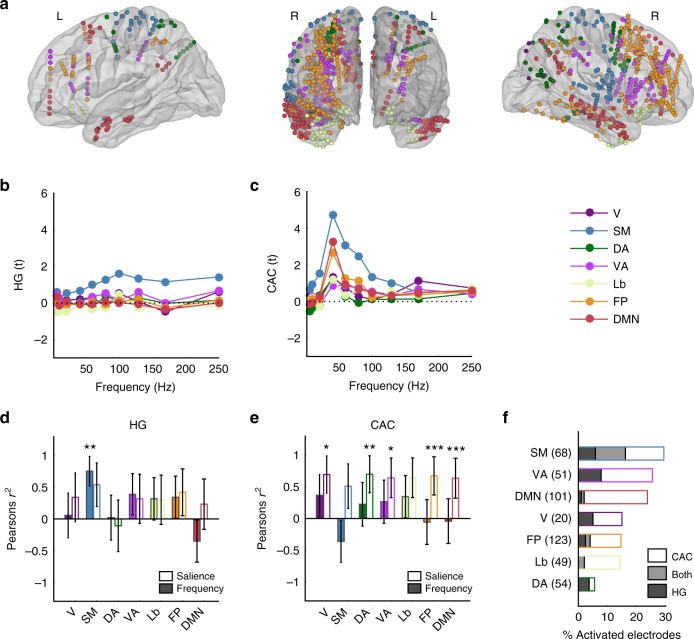
Fig. 6.
HG and CAC response patterns in functional connectivity networks. a Anatomical and functional categorisation of electrodes based on functional connectivity networks: sensori-motor (SM); limbic (Lb), default mode (DMN), ventral attention (DA), fronto-parietal (FP) and dorsal attention (DA). b HG responses (expressed in t-values relative to the baseline) averaged within regions and across participants at each stimulus frequency. c Same as in (b) for CAC. d Pearson’s correlation value (r2) between onset HG responses and stimulus frequency (colour-filled bars) or salience (empty bars). Error bars indicate SE of the correlation. e Same as in (d) for CAC. f Proportion of activated electrodes exhibiting significant HG onset responses (dark shading), sustained CAC (no shading) or both (grey shading) in each network. Numbers in parentheses on the y-axis indicate the overall number of electrodes located in each network. *, ** and *** indicate significant (corrected) p-values at 0.05, 0.01 and 0.001, respectively

